Friday, December 30, 2016

Blog Post -- Year In Review -- 2016!!

Well, it appears that the New Year of 2017 is upon us.  Since that is the case, I thought that a look back at the first full year of "Mike Thinks Blog" would be useful to those readers just joining us.  The adventure on the blog is multifaceted in theory:


1) Deal with large numbers reported in the popular news which are easily overlooked.


2) Untangle difficult concepts in science which are unfolding as research is being performed.


3) Demystify the life of a scientist.


Pretty simple right?


In the paragraphs below, I discuss how the blog posts on the site over the last year relate to or are categorized under the three categories above.  Click on any of the highlighted words (or underlined text) to access the original posts.  Enjoy!


2016 Here We Come!


About this time last year (in December), I had just returned from celebrating Christmas with my family.  As I mentioned in a recent post on rainfall, I was celebrating Christmas and heard of a large volume which remained in my mind for a few days to simmer.  I had been contemplating writing on a blog site -- since the current blog site that I had been writing for was recently shut down.


Anyways, the statistic that I heard was that Lake Tahoe had received a terrible storm which dropped a large amount of snow (great for skiers).  The rainfall totaled 65 billion gallons of rainfall?   Upon hearing this, I was taken back.  In fact, for the remainder of the vacation -- in the back of my mind was the number 65 billion gallons of rain.


While this number stuck in the back of my head, I read in the news that a village in Brazil experienced a large volume of 'mine waste water' from a reservoir and decided to look into the accident.  I am always astounded that regulators allow large corporations to put villages or surrounding regions in jeopardy while building up tremendous volumes of waste water.  Of course, the result of 'not regulating' properly is floods and contaminated drinking and bathing water. The total amount of waste water spilled turned out to be 15.9 billion gallons of waste water which is equivalent to 78 Deepwater Horizon Oil spills!!!!!!  WOW!!!   Looking at the number reported -- 15.9 billion gallons of waste water begs the following question:


How does one caste the enormous number into perspective?


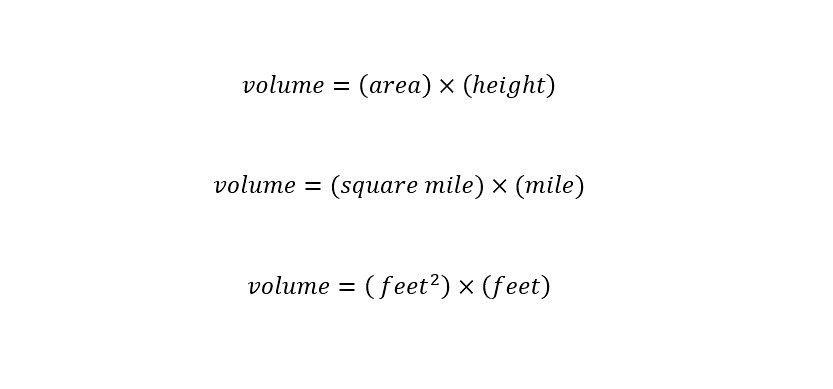
A large part of being a scientist is deconstructing numbers and statements in comparison to what is known about the world (through science).  The deconstruction process usually involves 'dimensional analysis'.  Dimensional analysis allows us to take a number like 15.9 billion gallons and put that number into perspective.  How?


The Deepwater Horizon Oil spill which dumped nearly 210 million gallons of oil into the Gulf of Mexico can serve as a metric by which to compare other large volume spills.  A metric serve to put the value or magnitude of a given number into perspective.  Of course, one can easily choose a metric which is too large or too small.  In that event, performing dimensional analysis with either of these metrics return an answer which is still confusing.


Additionally, ensuring the 'units' of measurement are all uniform in a given analysis is extremely important.  In the spring time of this year, I clarified the need to use proper 'units of measurement's (in a blog post) in carrying out a dimensional analysis problem.  These points beg a further question:


Why would we want to understand the enormous numbers reported?


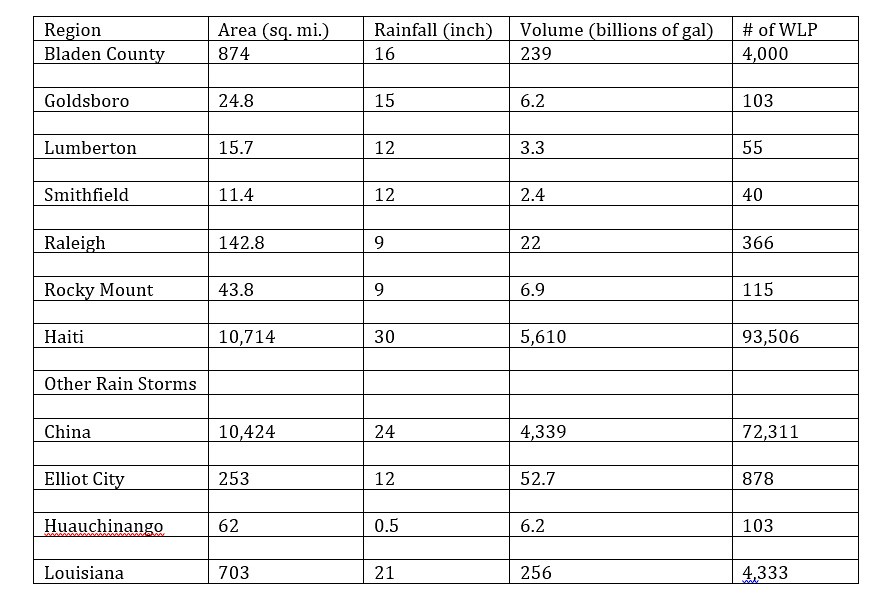
The main reason is to have the ability to understand the magnitude of the volume which is correlated with the tremendous damage that can be done to a geographic area.  Over the course of the year, unexpected rainfall has occurred in the following regions which I have written blog posts with dimensional analysis included:(1) China, (2) Elliot City, (3) Huauchinango, (4) Macedonia, (5) Louisiana  (6) Haiti (Hurricane Matthew), (7) East Coast, USA (Hurricane Matthew).


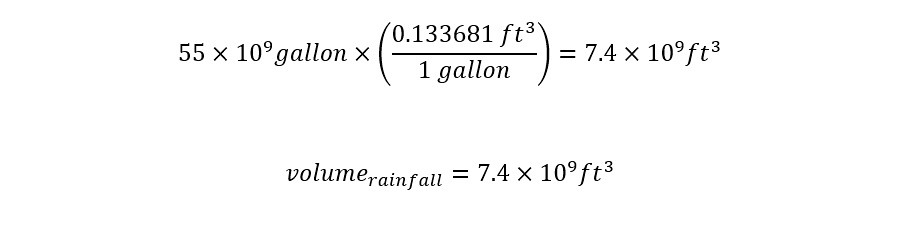
This rainfall series started off with initial post regarding a few inches of rain from the 65 billion gallon statistic that I heard last year.  Although, the tremendous amount of rainfall this year from varying storms is worrisome despite what non-scientists think.  Recently, a report of rain in Northern California area stated that one region received 55 billion gallons over the course of the rain season this year.  Just think, these numbers might seem insignificant to you (the reader) had I not carried out dimensional analysis to make the numbers have meaning.  This is how the year started off and carried on for natural disasters.


What about man-made disasters?


Man-Made Disasters?


The storm season of 2016 was unprecedented to say the least.  Rainfall hit enormous numbers in known and unknown parts of the world.  The culprit is still unknown.  Science is heavily skewed toward climate change.  Although skeptics exist and are in powerful positions.  Chances are that the same skeptics are proponents of 'man-made disasters' too -- which 2016 brought on plenty of.


On this blog site, stories started to emerge following the devastating release of huge amounts of methane gas in a storage facility in Southern California.  The Aliso Canyon Gas Storage facility with its 114 gas wells serves as the largest reservoir in California.  Therefore, when a well was found to be leaking, unknown amounts leaked out -- in the beginning.  I wrote a first blog post when I read about the enormous amount of gas being stored underneath ground -- 87 billion cubic feet of natural gas was stored at the facility.  WOW!!


By carrying out dimensional analysis, the amount of 87 billion cubic feet of natural gas amounts to roughly filling 2351 Empire State Buildings or 696 Super Domes.  These numbers are hard to grasp.  Further, the length of the line that tapped into the well underground was equivalent to stacking 5 Empire State Buildings on top of one another.  Oh My.  Try to find a leak in that line.


As time moved on -- roughly a month, new figures started to emerge which was cause for further concern.  Turns out, that there is an additional 82 billion cubic feet of "cushion gas" down there to provide pressure to extract the gas.  I wrote a blog post that detailed the correspondence between a reporter and myself regarding this "cushion gas".  Further, the average daily magnitude of released methane was explored too by myself -- here.


The major take home was that different figures emerged and incomprehensible numbers were thrown around in hope of the public glossing over such a terrible disaster.  Luckily, a few advocates have stuck with the pressing issue and the storage facility remains closed until all wells have been inspected.


Moving onto other disasters that were caused by 'man-made' feats to improve our quality of life.  Earlier in the year, I was amazed to learn that underneath Los Angeles (California, USA) are nearly 5000 oil wells.  Los Angeles was literally built on top of oil -- as I write about here.  Of course, the amount of oil produced in Los Angeles on an annual basis is nearly zero compared to the global daily demand of oil -- of which I was surprised to read and write about.  94 million barrels of oil is required on a daily basis to drive our world.  This might not seem like a lot in thinking about the daily demand of the entire world.


Although, when you experience the 'fall-out' of such demand, you might think twice.


What do I mean by this?


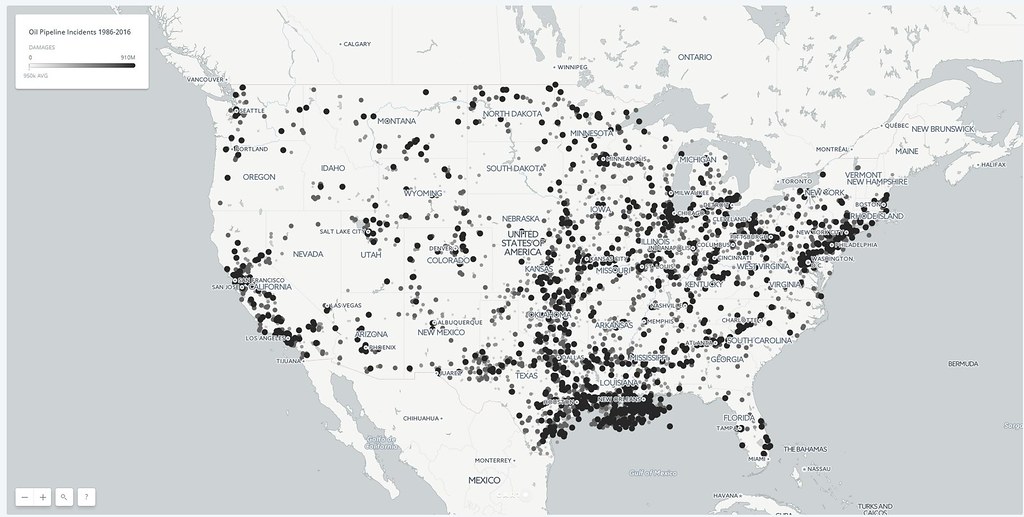
Earlier this year, I took my wife to a beach (Venice Beach) in California.  I grew up here.  I was disappointed to see that the water had been growing tainted with 'tar-balls'.  With the Dakota pipeline in the news recently with the Sioux Indian Tribe protesting the expansion, the following questions emerges:


1)Does Oil Demand Restrict The Amount Of Safety Regulation On Big Oil Companies?


2)What Technology Is Being Installed By 'Energy Transfer' To Prevent An Oil Spill?


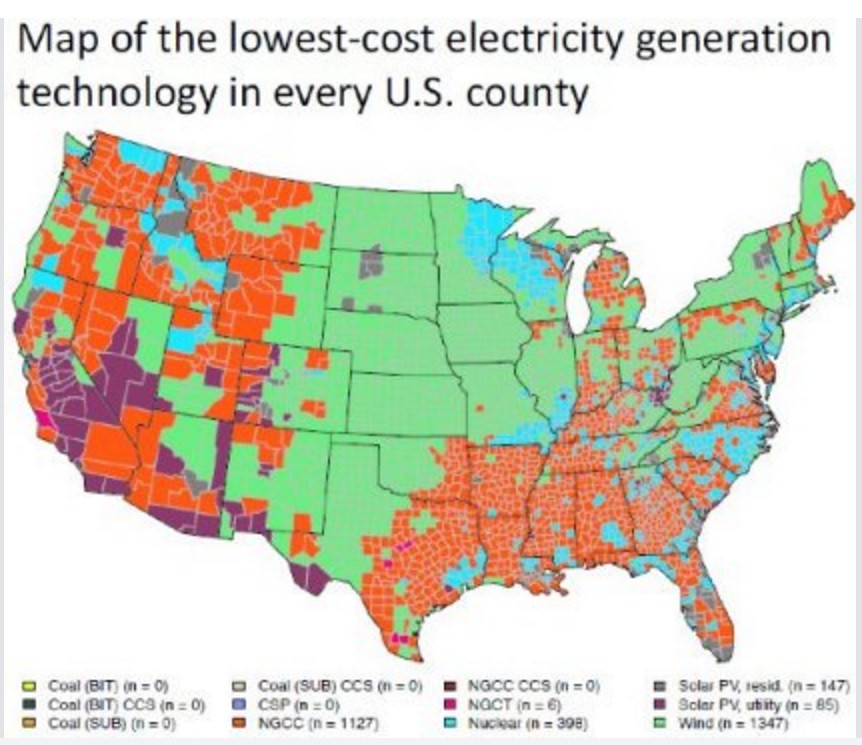
In the future, these will be issues which we need to face as a world.  I offered a few solutions in a blog post about bringing jobs back to America by promoting renewable energy.  We will have to wait and see how that plays out with the new President-elect Donald Trump's incoming administration and policy making.  During the course of the month of November, I covered science policy issues in the following blog posts:


1) 20 Questions Politicians Answer Regarding Science Issues


2) READ THIS BEFORE VOTING -- Presidential Science (WORLD) Issues!


3) What Do The Election Results Have To Do With Veterans Day?


4) Free Speech Is The Least Of President-Elect Trump's Problems Ahead


The future will be fascinating depending on how the President-elect decides to treat science and fund renewable energy.  Especially, with the fact that such a large amount of top CEO's like Bill Gates and Sir Richard Branson are motivating a move toward a renewable energy based market with an environmentally friendlier footprint.  This is not to say that our Nation is still not heavily dependent on oil.  Our foreign policy is heavily influenced by the dependence on oil.


Over the course of the year, we learned from the popular news that these 'man-made disasters' are not restricted to the United States soil.  In fact, there were a number of disasters that were not reported or I could not cover -- yes, I am only one person writing.  This does not mean that we as a Nation are not affected nor need to ignore potential threats to us.  Furthermore, our Nations foreign policy is affected by disasters.


For instance, earlier this year a news article surfaced which stated that if the Mosul dam in Iraq was taken over by ISIS, a flood could occur which would drown the city of Mosul in 65 feet (depth) of water.  The result of my calculations was that 65 feet would be the depth if the dam was filled only 66%.  Therefore, if the Mosul dam is filled higher, then more damage would result.  Just this week, another story about the dangers of the Mosul dam appeared in an article in 'The New Yorker' titled "A Bigger Problem Than ISIS?".  As you can see, understanding the magnitude of the problem can help you understand the problem at hand.


Furthermore, the amount of oil that is underneath the ground in countries like Iraq along with our presence (military and civilian) reinforces that dependence.  According to an assessment on one of my blog's is that the amount of oil underneath Iraq is around 140 billion barrels -- which is enough to meet the global daily oil demand for 4 years!!!


That is it - 4 years worth?


What happens after that?


The answer should involve building upon renewable energy technologies and investing in clean energy.  This is where science and technology companies can step in and offer help.


Scientists Are Human?


Yes, believe it or not, scientists are human.  One motivation of this blog is to demystify science/life of a scientist.  In order to move toward more highly skilled labor jobs, science and technology industries and universities will have to step up and highlight the importance of Science, Technology, Engineering, and Mathematics (STEM).  Furthermore, we must motivate minorities and women to engage in pursuing science degrees.  Science knows no race or gender or wealth disparity.  Any bright mind can contribute to science.  In order to accomplish this, the life of scientists must be demystified -- i.e., made human.


Early in the year, I posted a blog post from 2014.  The topic was the lack of elevation of STEM.  In the particular case, the White House Science day celebration story ran on page A14.  Why not put the story front page?  If we want people to pay attention to the importance of science, then the story and importance of the story should be front page with a huge picture.  Science is actually fun.  Despite the popular images on television which are fictional -- of a scientist in her/his lab researching all alone and serious.  At the same time, science is competitive and can seem at times 'cut throat' in nature.


This raises another desperate need in science.  To bring back the joy and fun in science.  In January, I got a chance to be a science judge at an elementary school.  I was quite surprised that the level of sophistication of the projects was matched with an adult.  We need to remember to let children be children and perform science projects that match their skill level -- which I wrote about here.  Subjecting children to science projects that are more difficult than their skill level could result in the child either not being interested in science or believing that they are performing science with their parents -- i.e., through someone else's action not your own.


The importance of working hard by solving problems in science cannot be stressed.  In chemistry, solving problems is critical to developing reasoning that is needed to grasp abstract concepts.  Part of this work might be done in isolation.  Other parts might be done in a group (tutor or group) study.  The ironic aspect of science is that hard work and reasoning will get you 99% there.  Being able to perform dimensional analysis is critical to casting large numbers into perspective.  I wrote a blog about estimating the amount of paint required to cover a movie screen.  One can easily extend this analysis to a real situation -- painting your house.  Further, working to educate others is critical too.  Helping other students reinforces the science analysis to a large degree -- which I write about here.


Blogging on this site has given me the chance to show others how to set up an approximation to solve a problem.  The answer could be far off, but the methodology is critical toward reaching a better solution which approximates the true situation.  Even if you (the reader) do not go into science as a profession, the opportunity still exists that a person can grasp a great part of science and contribute to science as a citizen -- citizen scientist which I highlight here.


As a scientist, I have my own reasons why science has captured my interest.  So much of an interest, that I chose to have a professional career in science.  As I mentioned in a previous blog, I was a scientist in the making from around the high school time frame.  I believe that every person interested in chemistry (or science more broadly) should pursue a career in it -- regardless of obstacles.  If you identify with the type of thinking displayed in this blog post, then definitely pursue chemistry.  Do you think like a chemist?  Cook some spaghetti and tell me if so (another blog post).


Scientists play a crucial role in society.  Scientist create drugs for the treatment and prevention of diseases.  Your taxpayer money funds research and development in a vast array of areas of science.  Science plays a critical role in advancing technology.  Just look at the works of Elon Musk and his pursuit to space from a commercial standpoint.  The results of such pursuits trickle down into autonomous vehicles -- which I highlight here.  Further, the CEO's of these large corporations have the ability to move science forward by providing 'private funding' -- which is very greatly needed and discussed here.


The most important role that scientists play in society is to motivate others through energizing the public about science.  In a recent blog post, I discuss the need for outreach by scientists is critical.  Get out of the lab and teach others about what you are doing and why your research is important.  Explain and demystify science while encouraging politicians and the public at large the need for research into climate change, drug research, space research, along with other areas.  Understanding science is critical toward conducting ourselves appropriately toward saving the planet (environment).  Having a public that is educated in science can help the public understand the greatest threats to our existence.


For instance, earlier this year I wrote a blog post about the nuclear weapon testing of North Korea.  These tests have real implications toward our destruction.  I used dimensional analysis to put the enormous amount of energy into perspective.  A couple of months later, I used a different parameter (force) to put the force of a nuclear weapon into perspective.  Recent calls by an incoming administration for an upgraded nuclear arsenal are feared (and rightly so) for good reason.  Nuclear weapons contain an enormous amount of energy which is nothing to mess around with.  Read the blogs to see if I am joking around.


That is one end of the extreme of science research.  The other is concerned with small end of the spectrum.  Viewing the world that is invisible to the naked eye is truly amazing and worth reading about.  In the middle of the spectrum lie issues that are more easily graspable.  For instance, living in California, each resident is aware of an ongoing 'drought'.  This begs the questions:


1) Where does the water come from?


2) How much water do California residents use?


Reading the two blogs highlighted in the above questions definitely sheds light onto the ongoing water problem.  Readers of this blog will know that the same amount of water used by the average Bel Air resident is equivalent to the amount of water needed to nourish 1,600 cattle.  Dimensional analysis is a powerful tool.  This is just one of the many examples on this site.


Science can further be of assistance in demystifying health issues too -- as most of us know.  Two big issues that plague the world are diseases that can be prevented and treated with medicine available on the market.  And secondly, diseases that arise out of bad habits like smoking, drinking, obesity, etc.  I recently wrote about the cost of prescription medications and how the cost could be decreased.  The process needs to be optimized in order to reduce overall cost.


Regarding lifestyle choices like smoking and drinking along with obesity.  Science can reveal a tremendous amount.  Although the research results are often controversial in the public eye.  Take for instance, the continuing rise of 'electronic cigarettes' or 'e-cigarettes.'  Many proponents of the new technology are pushing the product as a new method by which to stop traditional smoking of combustible paper and tobacco.  Science has a tremendous amount to say already about the hidden dangers.


First, trading off the combustion of paper and tobacco for the 'vaporization of liquid tobacco' might seem less troublesome on the body.  Although, as we have seen in the news over the last few years, the rise in use of e-liquids on the market has presented difficulties.  I highlight some associated with the unknown quantities of tobacco contained in a jar of e-liquid here.  This post along with a different post discussing the dangers associated with the mechanical operation of the e-cigarette device were reprints from a previous blog site that I blogged on.  At this point, you might be tempted to think that science is out of date on the issue of e-cigarettes.  Not so.  Stay tuned in a future blog on the chemistry of the smoke based on recent research that has just emerged.  e-cigarettes are dangerous just like any tobacco product. The question is the degree of the danger.  Science will have more to say in the near future.  Stay tuned!


Science is great, yet requires dedication and hard work to achieve.  A large amount of people with whom I speak on a daily basis have wild ideas about what scientists do and think. One overarching motivation of this blog is to demystify this idea.  Here are a few more blog posts throughout the year that caught my attention to write about:


1) Does a Golf Ball have more than one shape (round)?


2) How Many Smells Can Humans Differentiate Between?


3) What do a coffee coupon and an outfit have in common? A Feeling!


4) Who Sells Sea Water? Who Buys Sea Water?


5) Where Is That UPS Package?


6) Humans Affinity For Junk Food Rubs Off On Bird Population


7) Active Transportation Implies That Every Bicycle Trip Is Considered "Commuting"!


8) Gender Neutral Restrooms Should Not Include "Urinals"


9) Are The Elements Hydrogen And Helium "Of This World"?


10) Why Do People Fly Drones Into "Restricted Air Space"?


11) What Is Holding You Back From Achieving Your Potential?


12) How Much Weight Can 54 Billion Cubic Feet Of Helium Lift?


13) Can A Broken Sewer Line 20 Miles Away Close The Beach?


14) 'Wayfinding' Signs Are For Everyone Not Just Tourists!


15) How Many Square Feet Would Be Required To House All Homeless Residents in Los Angeles County?


16) After Reading This, You Might Want To Drink Breast Milk


17) How Does The Weight Of A Floating Oil Rig Compare To The Eiffel Tower?


18) Technology Allows Chemists To View Chemical Reactions 


19) Humor Series #1: We Live In A World Where ...


20) Why Is There Another Oil Spill?


21) An Alternative Way To Tour A City — By Your Nose!


22) How Deep Is One Of The World's Largest Wave Tanks?


23) Unraveling The Resistance Of Antibiotics!


24) What Is The World Going To Be Like With Autonomous (Self Driving) Cars?


25) Using Scavenger Hunts To Solve Real World Problems?


26) Why Did Pfc. Chelsea Manning Divulge Classified Information?


27) What Happened To Being Yourself Instead Of Ivanka Trump?


28) Why Doesn't Pre-Regulation Of Consumer Products Exist?


29) Is Disease Or Treatment Different In Women?


30) The NFL Is Collecting Big Data?


31) How Much Would The Sun Weigh If Filled With Water?


32) International Students Make American Science Stronger


33) How Much Water Is 55 Billion Gallons Of Rainfall?


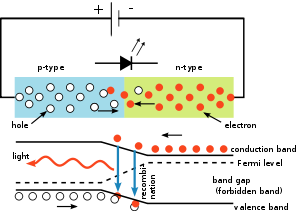
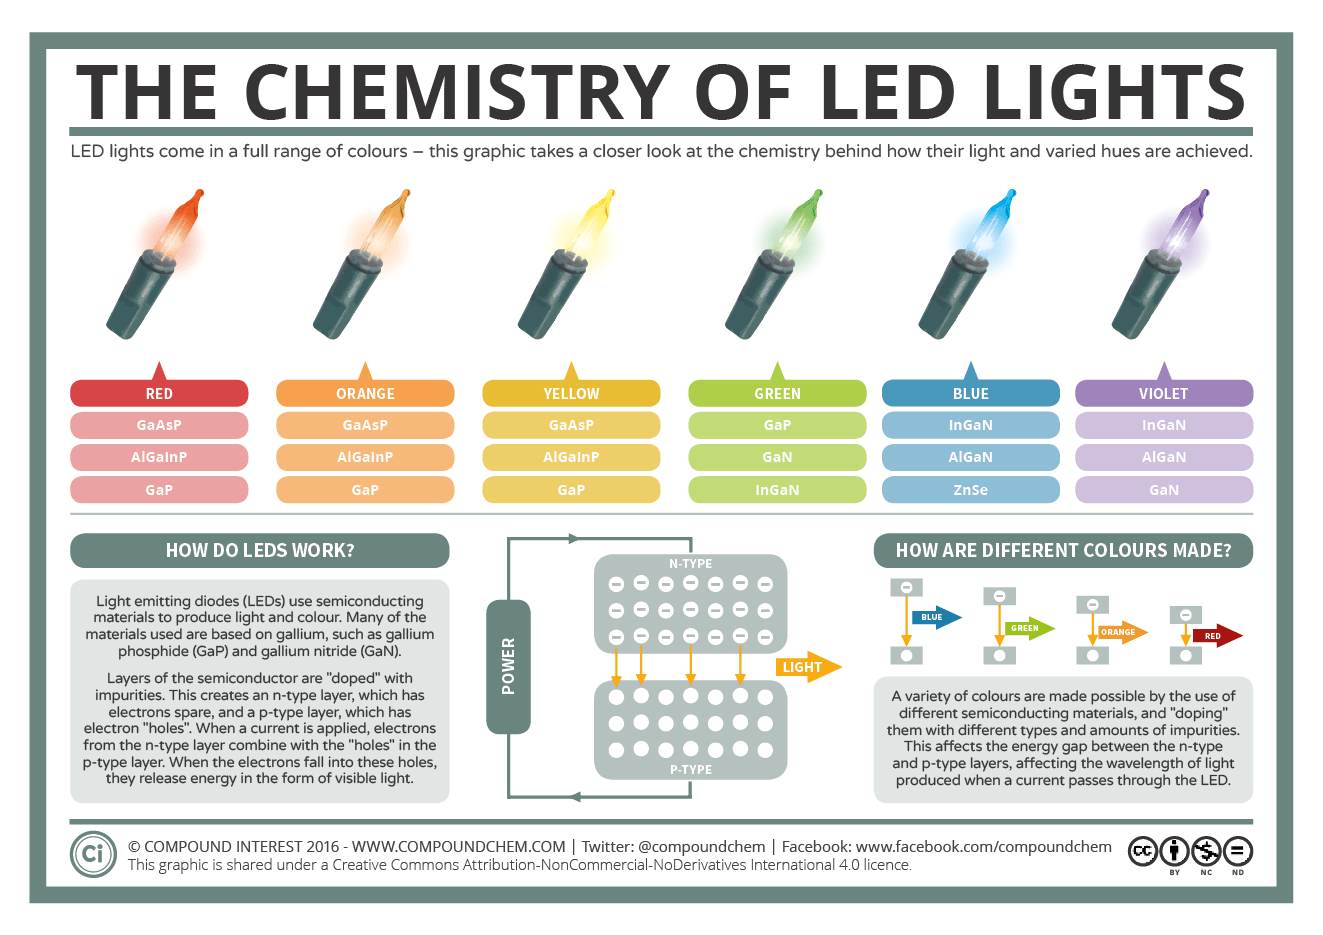
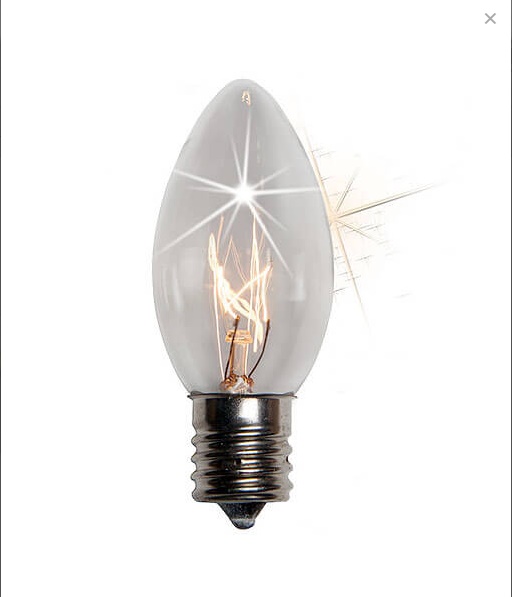
34) How Do LED Christmas Lights Work?


35) Own Your Failure, Do Not Blame Your Teachers


The blog posts just numbered are posts that were based on articles that stood out and did not necessarily have any outrageous number or statistic cited.  Science is a wide subject that touches every aspect of our lives.  If you do not believe me, read (or click) on any of the underlined or hyperlinked text above and read to find out if I am wrong.


Conclusion...


The year of 2016 has been a very active year for scientists who write about current issues.  There have been too many disasters that have occurred.  In the year to come, President-elect will make decisions that have a global impact.  I will try to highlight the science behind such decisions.  Of course, I cannot get to every article or issue.  Given the news already, there is inevitably going to be news worthy of analyzing by the method of dimensional analysis to come.


Remember that the overarching theme of this blog is to write through the eyes of a scientist.  If at any time, you have a topic that you would like me to explore, just write the topic in the comment section.  Science is truly amazing and worth exploring.  I hope that I have given you a rough idea about the profession of a scientist.  Additionally, I hope that by reading the blog posts on this site, you (the reader) has gained a little more insight into the importance of science on society and the world at large.


I will be on vacation the next week.  I look forward to returning in the new year (late next week) to release more interesting articles.


Until next time, Have a great day and Happy New Year!!!!!


Monday, December 26, 2016

Own Your Failure, Do Not Blame Your Teachers

Now that the academic semester has ended and the gift giving holiday has passed (Christmas Day), the New Year is upon us.  During these times, a little bit of reflection is in order with the following questions:


Where am I at in my life?


Where am I headed?


If you are a student, the answers are immediately based on the current academic classes (most likely) -- which are based on the successes of the previous classes completed.  This is a normal process for each student during their academic journey.  Unfortunately, there exists "outliers" who never learn to perform this introspection during this part of the year.  The last statement begs the following questions:


Who are these people?


 Where do they end up in life?


I do not pretend to have all of the answers to the world.  I can supply an example from the recent news which will shed light on the last question -- which is where they will end up.  Below is the example.


Own Your Failure


One of the critical lessons to learn in life for anyone is to 'own your own failure.'  Which is to say, instead of blaming others for your failure, take ownership of the failure and move on with success.  I imagine a few readers might be thinking the following: Easier said than done!  Yes, in some cases that is true.  Although, the daily practice of ownership is important and could serve each of us quite well.


In a news article from 'The Guardian' earlier this month titled "Graduate sues Oxford University for £1m over his failure to get a first" the discouragement of a students success is told as a result from a single course he completed 16 years earlier.  Here is the broad argument of the lawsuit by the alumni in the excerpt below:


Siddiqui, 38, who trained as a solicitor after university, says his life and career have been blighted by his failure to obtain a first when he graduated in June 2000. He said he underachieved in a course on Indian imperial history during his degree because of “negligent” teaching which pulled down his overall grade.


More specifically, he is claiming that the error occurred as a result of the University's inability to properly staff the classes.  Again, the specifics are fuzzy, but here is an excerpt from the article:


Siddiqui has said the standard of tuition he received from Dr David Washbrook declined as a result of the “intolerable” pressure the historian was placed under. In the academic year 1999-2000, four of the seven faculty staff were on sabbaticals and the court heard from Siddiqui’s barrister that it was a “clear and undisputed fact” that the university knew of the situation in advance. He told the judge that of the 15 students who received the same teaching and sat the same exam as Siddiqui, 13 received their “lowest or joint lowest mark” in the subject.

Mallalieu told the court: “This is a large percentage who got their lowest mark in the specialist subject papers. There is a statistical anomaly that matches our case that there was a specific problem with the teaching in this year having a knock-on effect on the performance of students.” He added: “The standard of teaching was objectively unacceptable.”


Mr. Siddiqui is one of several students who received a bad grade during that exam and course -- for that matter.  Where are the other disgruntled students?  Further, the problem resides around Mr. Siddiqui's inability to accept the 'contract' that each student agrees to when enrolling in a course at a University.


In a blog post that I wrote for another site (professional - LinkedIn), I highlighted in the beginning that each student enters an informal contract with the university when enrolling in a course.  The agreement of the contract is centered around the following two principles stated below:


1) Students agree to follow the university rules (attendance, assignments, etc.).

2) Faculty and Staff agree to uphold their part and provide a quality education to each student.


As I stated in that blog: Do we live in a perfect world?  No!  But each of us need to do our agreed upon part in the educational process.  Students tend to forget that each of them hired the university to teach them a certain skill set.  That is an agreement.  Not a pay and take all (meaning I pay and receive the degree with no work) process.  School is not easy.


The largest problem with blaming teachers in the educational process is that data speaks volume in the teachers favor.  What do I mean by this?  Not every teacher is wonderful.  But most teachers have a track record with a large amount of students over the course of many years.   How often do students return decades later and thank their instructor for teaching them properly?  No more needs to be said regarding placing the blame on the teacher.  Lets focus on the student in this case.


In the article above, the obvious fall-out from such a lawsuit is the 'flood gates' that can be opened for future lawsuits that are obviously flawed and based on failure (on the students part) to take ownership.  Additionally, if low grades were given to 13 other students, in order to rule in favor of him the following questions would have to be answered:


1) How was he professionally impacted by the low grade?


2) Why did he wait such a long time to bring the lawsuit against the university?


3) Why have other students not stepped up and joined the lawsuit?


4) Why have other students not spoken out about the low grades?


5) How can a court prove that there is a link between a grade and professional failure?


6) How does the court rule out psychological problems at play in the lawsuit?


I was fascinated to read that there were no other students speaking out about the incident.  I imagine each of them have moved on and attributed the low grade to 'bump in the road.'  Regardless, the length of time in between the course and the lawsuit is extremely suspicious among other factors in the case.  In time, more might be revealed about Mr. Siddiqui.


Each of us need to take ownership of both our progress and failures.


Conclusion...


What is disappointing about the article and the lawsuit is that the student has now grown up to be a professional who has not learned to take ownership for his failures.  Which is extremely sad.  Imaging what his life is like?  Living day to day with 'bad grade' hanging over his head and affecting his current progress.


There will be many failures in life along our professional development.  The time is now to accept them and move on.  As I tell people constantly about the potential failure of dwelling on the past to such a large degree -- think of the process as driving a car.   Ask yourself the following question:


Would I drive forward while looking in the 'rear-view' mirror?


Of course not!  You would hit some object (car, human, etc.) by not looking forward but focusing on the past.  Each of us should do the same with our success and failure.  Move forward accepting the past.


Until next time, Have a great day!


Friday, December 23, 2016

How Do LED Christmas Lights Work?

Pre-Merry Christmas!  Christmas is practically upon us.  If you have been outside, then you have undoubtedly noticed that certain houses and buildings have 'Christmas lights' draped on their structures.  A transition is taking place in the 'lighting industry' from a traditional incandescent bulb toward a 'light-emitting diode'.  Light-emitting diode sounds futuristic.  And in some forms appears to be futuristic due to the narrow bandwidth of light -- precise wavelength.  Some people complain that the traditional 'glow' is gone with the transition from 'incandescent lighting.'  I would say to that statement: hold on -- technology is improving at light speed.


Traditional Christmas Lights


As I mentioned above, the traditional "Christmas lights" were a glass bulb and bulky among other difficulties associated with them.  One major hassle associated with setting up Christmas lights was the inspection of each light bulb on a string of lights in order to determine the culprit (faulty light bulb) before lighting the string.  The laborious process was time consuming and resulted in great frustration.  Although, after hanging Christmas lights up, the seasonal glow that is felt upon viewing them is inexplainable and worth all of the trouble.


How is the 'Glow' generated in old Christmas lights?


Traditional Christmas tree lights are incandescent light bulbs.  Incandescent light bulbs have dominated the market over the last century.  Here is a picture of an 'incandescent Christmas light bulb' shown below:


As you can see, there is a wired that is asymmetrical (wounded irregularly) in winding in the center of the glass bulb.  The operation of the bulb is described as follows:


The incandescent light bulb or lamp is a source of electric light that works by incandescence, which is the emission of light caused by heating the filament. They are made in an extremely wide range of sizes, wattages, and voltages.


As current travels through the wire, heat due to resistance is generated.  Eventually, the heat is given off as light.  There is still heat given off too.  The warm glow produced by the incandescent light bulb remains to be a large challenge for Light-Emitting Diode makers.  Although, the downside of using incandescent light bulbs is the heat loss associated with the operation.  This could be problematic with lights on a Christmas tree.  The heat from the incandescent light bulbs dries the Christmas tree out.  In the extreme case, the heating could cause a fire.


The above explanation was part of the motivation to produce a more efficient light bulb that does not over heat with continued operation over a long period of time.   Despite the move toward greater use of Light-Emitting Diode lights, the traditional incandescent light is still in wide use today.


Light-Emitting Diodes?


Technology has improved greatly with the introduction of the semiconductor.  Other spin-off technologies are numerous (and I do not need to go into them).  Anyways, typically, when the technology is discussed, the usual turn-off of attention is achieved on the part of the listener.


For example, new Christmas lights are made of "light-emitting diodes".  The "wikipedia" contains the following definition of LED:


A light-emitting diode (LED) is a two-lead semiconductor light source. It is a p–n junction diode, which emits light when activated.[4] When a suitable voltage is applied to the leads, electrons are able to recombine with electron holes within the device, releasing energy in the form of photons. This effect is called electroluminescence, and the color of the light (corresponding to the energy of the photon) is determined by the energy band gap of the semiconductor.
An LED is often small in area (less than 1 mm2) and integrated optical components may be used to shape its radiation pattern.[5]
Appearing as practical electronic components in 1962,[6] the earliest LEDs emitted low-intensity infrared light. Infrared LEDs are still frequently used as transmitting elements in remote-control circuits, such as those in remote controls for a wide variety of consumer electronics. The first visible-light LEDs were also of low intensity and limited to red. Modern LEDs are available across the visible, ultraviolet, and infrared wavelengths, with very high brightness.
Early LEDs were often used as indicator lamps for electronic devices, replacing small incandescent bulbs. They were soon packaged into numeric readouts in the form of seven-segment displays and were commonly seen in digital clocks.
Recent developments in LEDs permit them to be used in environmental and task lighting. LEDs have many advantages over incandescent light sources including lower energy consumption, longer lifetime, improved physical robustness, smaller size, and faster switching. Light-emitting diodes are now used in applications as diverse as aviation lighting, automotive headlamps, advertising, general lighting, traffic signals, camera flashes, and lighted wallpaper. As of 2016, LEDs powerful enough for room lighting remain somewhat more expensive, and require more precise current and heat management, than compact fluorescent lamp sources of comparable output. They are, however, significantly more energy efficient and, arguably, have fewer environmental concerns linked to their disposal[citation needed].


As mentioned in the excerpt above, the LED has taken over the world to replace conventional light sources.   One major reason is the large amount of energy saved by operating a LED compared to a traditional light bulb.  Additionally, the LED Christmas light has a more durable coating and therefore is more stable and longer-lasting.


After reading the excerpt above (first paragraph), you might still have an issue with understanding the operation of the LED.  In a recent article 'Compound Interests' titled "The Chemistry Of Lights" a simple explanation is put forth regarding the operation and design of the LED light.  I am a big believer in "not re-inventing the wheel."  Therefore, I love to share good explanations when I come across one.


Here is an excerpt regarding the operation and structure of the "light-emitting diode":


LEDs consist of two layers of semiconducting material. The layers are “doped” with impurities, which is to say that atoms of elements other than those originally in the semiconducting material are mixed in. This doping can create different types of layers: p-type layers and n-type layers. The n-type layer has a surplus of electrons, whereas the p-type layer has an insufficient number of electrons, and as such has what are referred to as electron ‘holes’: positions in atoms where an electron could be, but isn’t.

When a current is applied to the LED, the electrons in the n-type layer and the electron ‘holes’ in the p-type layer are driven to an active layer between the two. When the electrons and electron ‘holes’ combine, energy is released, and this is seen as visible light. While this explains how light is produced, we have to look a little more closely at what’s going on to explain how different colours can be obtained.

The colours obtained from LEDs are determined by the semiconducting materials used. As you can see in the graphic, there’s not just one material used for all of the different colours, but a range of possibilities. By using different materials, and adding different impurities to these materials, we can change the size of the band gap – that is, the size of the energy difference between the n-type layer and the p-type layer. The bigger this band gap, the shorter the wavelength of light produced by the LED. So for a red LED, a relatively small band gap is required. For blue LEDs, a larger band gap is needed.


Simply beautiful!


 What does such a structure look like?


That is a trick question since the title of the blog post is Christmas lights!  Below is a diagram taken from the 'wikipedia' page for 'LED':


The image above appears to resemble the traditional Christmas lights that are seen draped on houses and buildings around town.  From the outside, this may be true.  Although, on further inspection of the image above, there is no 'filament' as we saw above in the picture of the incandescent light bulb.


Why not?


According to the two descriptions of the Light-Emitting Diodes above, the structure is slightly different compared to an incandescent light bulb.  Remember terms 'p-n junction' etc?  A structure of an LED was taken from 'wikipedia' for clarity and is shown below:


Source: S-kei


According to the picture above, if the current (in the form of electrons) travels through the 'n-type' material toward the interface of the two types of material 'p-n junction' (in the center at the boundary of blue and yellow), the corresponding 'hole' moves toward the 'p-n junction' from the blue side.  At the boundary layer, the two are combined.  The combination of the electron and the positive 'hole' at the junction corresponds to light emitted.


Furthermore, if the 'p-n junction' is changed (made larger or smaller) the frequency of light (color) is changed too.  Therefore, the light given off at the 'p-n junction' is precise.  As I mentioned above, one downfall of the LED compared to the incandescents light bulb is the lack of 'glow'.  The factor which gives the light a glow is the 'broad spectrum' of wavelengths (mixture of colors).  In an LED, the interface -- i.e., 'p-n junction' is precisely tuned to give a sharp and very well defined frequency.


The above description was off of the site 'Compound Interests' whose design to display information is in the form of a 'poster' like the one shown below:


I chose to expand on the description given in this poster.  The producer of the above infographic did such a great job, that I felt the need to share this with the public at large.  This infographic went out to the science community last week.  Here are some closing thoughts...


Conclusion...


The movement toward LED technology is on the rise.  There are benefits toward using either type of Christmas light.  LED lights give off a very well defined wavelength (or frequency) of light which results in a crisp sharp light.  Whereas the traditional incandescent lights give off the warm 'glow' made up of a few different color components.  Secondly, there is less heat given off with an LED light compared with the incandescent light bulb.  Which results in greater efficiency.  Finally....


As you travel the world during the holidays, hopefully, your viewing of the many different Christmas lights will be enhanced by this blog post.  Try to identify which Christmas lights use LED technology and which use incandescent light technology.  I hope that each and everyone of you have a wonderful and safe Christmas.  Cheers!


Until Next time, Have a great day!


Monday, December 19, 2016

How Much Water Is 55 Billion Gallons Of Rainfall?

As the water season began (at least that is what is reported by the news) in early October of this year, news accounts will be arising discussing various rainfalls.  Certain accounts will detail the much needed rainfall while others might even scare readers of the excess rain and the damage that might follow.  Regardless, the way the news agencies reports rainfall is often misleading and uneventful.  Below, I discuss one example from the "Los Angeles Times."


How Is Rainfall Reported?


Over the course of the last year, I have started to write about the reporting of rainfall.  I am constantly amazed at the subtlety with which large volumes of rain are reported after a given storm.  This problem of mine started back near the end of 2015 -- after reading a report of a storm.


Before I get into the initial motivation to investigate news reports about volumes of rain fall, I would like to say that I am still baffled why the news reports "inches" of rainfall while total volumes in units of "cubic feet."  I would prefer the units of total rainfall reported in units of "gallons" -- personally.  The reason is that I can visualize using a few metrics (large volumes -- pools, stadiums, etc.) to compare the reported values to.  Although, one could argue that my request is just unique to me and I could just as easily perform dimensional analysis to get the units that I feel comfortable with.  Fair enough!


During the end of the month of December of 2015, large volumes were reported and I wrote an initial blog post about this rainfall in following month.  Accuracy was not the first and foremost during this storm -- which concerned me.  The reason why is in the numbers.  Let's take a look briefly at the reported numbers which in some cases were skewed or miscalculated.


In that blog post, the news reported a number based on the weather service of 65 billion gallons of water from a single storm -- which is an enormous amount of rain.  One of my family members told me this factoid and stated that 65 billion gallons of water equated to increasing the water level of Lake Tahoe by 6 inches.  Meaning, that enormous amount of rain if collected and poured into Lake Tahoe would result in an increase of 6 inches of height to the lake.


After hearing that number, I sat back and thought -- Wow -- that means that Lake Tahoe is larger than I thought.  This factoid bothered me for a few days.  As a result, I decided to carry out a few calculations which are shown in the blog post.  I will get to the point.  The result of the calculation gave a volume that was very different than the volume reported by the news.


What was I to make of this disparity in volumes?


Did I make a mistake in my calculation?


Did my approximation not make sense?


Check out the blog to understand my full thought process in calculating using a simple approximation -- that of a cylinder.  The result of the calculations revealed that the total volume of rainfall in that particular storm was 6.5 billion gallons NOT 65 billion gallons.  A factor of 10 different in the reported statistic.


Should we be concerned by the lack of accuracy in reporting?  


Yes.


Two major results came from that practice:


1) The volume I calculated was correct.


2) The weather station corrected their reported volume after checking their calculation.


3) I learned a better method by which to perform dimensional analysis of rainfall using reported volumes.


Out of this exercise came the correction of the weather station.  Again, all of this is in the blog post.  Additionally, I learned that method by which the weather stations use (one of the methods) to calculate the volume of rainfall in a given storm.


After carrying out the exercise and writing the blog, I decided that from that point on forward, I would watch news accounts of rainfall volume in the future.  Further, I would look out for reported statistics and try to put them into perspective for the reader using dimensional analysis.  The result has been the blog posts that make up this site.


The results of previous blog posts this year so far regarding the total volume of rainfall have been collected into a table shown below:


Note: Click on any of the cities to access original blog post (with calculations) on this site -- (1) Bladen County, (2) Goldsboro, (3) Lumberton, (4) Smithfield, (5) Raleigh, (6) Rocky Mount, (7) Haiti, (8) China, (9) Elliot City, (10) Huauchinango, (11) Louisiana -- and I forgot (12) Macedonia


The first seven storms listed in the notes above are a result of Hurricane Matthew which ripped through the Eastern part of the USA originating from Haiti.  The last five storms listed are storms that have occurred due to unusual rainfall this year.   Recently, the Associated Press covered this in a story about the National Oceanic and Atmospheric Administration released report on rainfall this year around the world with implications toward Climate Change.


Regardless, the enormity of the storms are worth writing about.  With that in mind, let's move onto the reported value of rainfall over the season thus far in Folsom (California) of 55 billion gallons so far.


How Much Is 55 Billion Gallons Of Rainfall?


In a recent story in the 'Los Angeles Times' titled "A tale of two droughts in California: Wetter in the north, still bone dry in the south" the disparity of rainfall between Northern and Southern California was discussed with varying numbers reported which would make a person mind spin.  One excerpt that stuck in my mind was the following regarding rainfall received in Folsom:


The recent rains were enough to force federal officials to begin releasing water from Folsom Lake to protect against flooding for the first time since March, said Louis Moore, a spokesman for the Bureau of Reclamation, which manages the reservoir. Since the beginning of December, Folsom has risen more than 20 feet — an increase of about 55 billion gallons.


Now, if you are a reader of this blog, then the number 55 billion gallons should stick out of the excerpt above along with the number 20 feet.  Further, with the previous blog posts on this site, you will understand my need to understand the magnitude of large numbers like this.  Numbers that are truly incomprehensible.  I believe that the value of 55 billion gallons of rainfall qualify for the analysis typically found on the site.


To start such an analysis to put the enormous number into perspective, a metric is needed.  A metric serves as a 'ruler' of measurement.  Metric's specifically take away all ambiguity when defined.  What?  I know that is confusing.  Basically, we need a measurement to compare the volume too.


Let's choose 3 volumes and see how the statistic of 55 billion gallons compare.  The 2 volumes will be: 1) World's largest pool  2) Lake Tahoe.


1) World's largest swimming pool:


To start an analysis of the volumes is to ensure that the 'units' of measurement are the same.  That is, for the example at hand, the volume of the World's Largest Swimming Pool needs to be expressed in units of 'gallons' to be directly compared to the volume reported above of 55 billion gallons.


The World's Largest Swimming Pool is shown below:


Source: Twisted Sifter


The volume of the enormous swimming pool is a whopping 66 million gallons.  That is huge.  If we express the volume of rainfall reported in the article in scientific notation, the number would look like the following shown below:


Remember, if the volume were written out in long form, the value would appear as follows: 55,000,000,000 gallons!  Expressing the number in scientific notation allows us to express the number in a compact form.  The volume of the World's Largest Pool can be expressed similarly in a compact scientific notation.


Since the units are of the volume are expressed in 'gallons' -- the number of swimming pools that could be filled with 55 billion gallons of rainfall can be directly determined by dividing the two volumes as shown below:


Wow!  The result can be interpreted as the following:


55 billion gallons of rainfall would fill 830 - World's Largest Swimming Pools!!!!!!!!!


How does one visualize that number of swimming pools?


Note: Since my last blog post using swimming pool in San Alfonso del Mar -- another pool built by the same company has built the new "world's largest swimming pool" -- Crystal Lagoon located in Sharm-el-SheikhEgypt.


Can you visualize a total volume of 830 of the above pools?


I cannot.  Maybe another metric is needed to better grasp the enormous volume of rainfall.


Sometimes our choice of a metric does not necessarily cast the volume in a graspable light.  For instance, trying to visualize the total volume of 830 World's Largest Pool combined is too difficult.  Maybe another analysis is useful with a larger metric to cast the volume is needed.


 In order to get a better grasp of the volume, a larger volume is needed to serve as a 'metric' to compare enormous volumes too.  55 billion gallons is not a typical volume.  Therefore, a larger volume is needed.  On a previous blog post on this site, Lake Tahoe has been used as a metric for extremely large volumes -- which this qualifies as that category.


Below is a picture of Lake Tahoe from Space:


Source: Snow Brains


Upon inspection of the photo above, Lake Tahoe is a huge lake.  The total square area of the Lake is 191 square miles.  In order to use this value as a reference to cast 55 billion gallons of rainfall into perspective, a little math will have to be performed.  But, we will take the process slow.  If at any point, you (the reader) need clarification, please leave a comment in the blog post below.


To start with, an equation for the volume of Lake Tahoe is needed.  Above, the surface area of Lake Tahoe is given as 191 square miles.  An expression (or equation) for the volume of an irregular shape like a lake is the following:


According to the expression above, the volume can rainfall can be determined by knowing the amount of rainfall that a storm delivered across a surface.  Meaning, if a circle is the two-dimensional surface, then by understanding how much water fell on the circular surface, the determination of the volume of a cylinder is possible.  By the way, the units of volume are 'cubic feet' or 'cubic mile' - etc.  Cubic feet is most likely easier to visualize -- since most of us have an idea of the dimension of a foot is in comparison to inches of rain.


Since in the present case, a volume is known, then in order to understand the magnitude of 55 billion gallons the question becomes the following:


How many feet would Lake Tahoe rise if 55 billion gallons were dumped into the Lake?


In order to start the calculation, a unit conversion is required to move on.  The second line of the volume expression states volume in terms of 'units of miles'.  This is not useful when discussing rainfall -- which is usually reported in units of 'inches'. If the calculation is carried out with units of 'miles,' then the results of the calculation would be expressed in 'miles' -- which would be difficult to interpret.


Rather than get an answer that is difficult to interpret, a conversion can be performed to units of feet from miles.  There are 27,880,000,000-square feet in a square mile.  With this conversion factor available, the units conversion is easy and shown below from square miles to square feet:


Next, take the answer (in square feet) and plug the value into the original volume above:


Shown above is an expression for volume with a value for the area (191 square miles) inserted.  There are still two unknowns left -- volume of rainfall and height.  In order to plug a volume into the above expression, a 'unit' conversion is necessary from 'gallons' to 'cubic feet'.  There is 0.133681 cubic feet in 1 gallon.  With the conversion factor in hand, the conversion is simple as shown below:


Next, if the volume of rainfall is plugged into volume equation above, we are left with one equation with one unknown (height) as shown below:


If we rearrange the above expression to solve for height from the total volume, we get the following:


Wow.  The following result states that if 55 billion gallons of water was dumped into Lake Tahoe, the water level would rise 1.4 feet in total.  That is just under 18 inches (1.5 feet).


Can you visualize the change in height?


Of course - why?  Because, I am 5 feet 7 inches tall.  I could stand next to the Lake (shown below) and visualize roughly the water level rising to my knees.  I can easily imagine Lake Tahoe filling up by 1.5 feet.  What I did not realize is that Lake Tahoe is enormous.


Further, take that measurement and look out onto the Lake and the visualization of 55 billion gallons comes into focus.  The choice of Lake Tahoe as a metric fits the dimensional analysis much better.  Half the battle in performing dimensional analysis problems is choosing the correct 'units' and 'metric' by which to compare the stated (reported) value in the popular news to.


Again, here is another picture of Lake Tahoe shown below (not from space):


Source: Lara Farhadi


Conclusion . . .


In the paragraphs above, a couple of metrics (world's largest pool and Lake Tahoe) to cast the enormous volume of 55 billion gallons of rainfall into perspective.  Both volumes represent two extremes of the entire spectrum.  Using the process of dimensional analysis, we were able to compare the volumes to the reported volume of 55 billion gallons.  Prior to this analysis, any attempt toward understanding the true magnitude of the statistic.


Too often, reading the news results in a lack of understanding of the true magnitude of large numbers.  Whether these numbers represent volumes, heights, miles traveled, electricity generated, there is a need to try to understanding them.  The avenue by which to do so is through 'dimensional analysis'.  The process is rewarding when you arrive at a result.  Regardless of the result.  Often times, more thought and analysis is needed to make further sense of the statistics.


Until next time, Have a great day!


Friday, December 16, 2016

Brings Jobs Back By Promoting Renewable Energy!

If jobs are lost to another Nation, one would think that instead of bringing the same job back, create a new one -- with a more intelligent worker.  Hold on here... more intelligent?  Yes, skilled workers working on jobs that promote a healthier and more environmentally friendly world.  With the recent victory over the North Dakota pipeline by the Sioux Indian Tribe, our mindset should be the following:


1) Inspect, test, and repair the existing millions of miles of pipeline in operation today.

2) Offer more incentives for businesses who are promoting the use of renewable energy to operate.

3) Follow the lead of major corporations moving toward green energy initiatives.


Why do I suggest the above steps as a mindset moving forward?


Below are a few thoughts to initiate the discussion forward.


30 Years Of Oil Spills


In a recent article from 'The Atlantic' titled "30 Years of Oil and Gas Pipeline Accidents, Mapped" Author George Joseph provides us with a great overview of the last 30 years of oil transportation using oil pipelines.  The article contains extremely informative infographics and visual illustrations which prove beyond a doubt that the last 30 years has been less than stellar for the oil industry -- as far as accidents go.


Using the recent Standing Rock Sioux Indian tribe's protest of the North Dakota pipeline, he jumps right into hammering down the truth surrounding accidents and oil pipeline with the following statements:


Oil industry supporters argue that pipelines are safer alternative to hauling fuel by tanker trucks or freight trains. “Environmental analysis comparing pipelines to rail finds pipelines will result in fewer incidents, barrels released, personal injuries, and greenhouse gas emissions,” says John Stoody, a spokesperson for the Association of Oil Pipe Lines, in a statement to CityLab. He cites an environmental impact statement conducted by the U.S. State Department comparing the impact of rail delivery of crude oil to that of the proposed Keystone XL pipeline. Additionally, a 2013 study from the conservative Manhattan Institute found that road transportation had an annual accident rate of 19.95 incidents per billion ton miles and rail transportation had 2.08 incidents per billion ton miles, compared to 0.89 incidents per billion ton miles for natural gas transmission and 0.58 serious incidents per billion ton miles for hazardous liquid pipelines.

Environmentalists, however, point to a lack of adequate state and federal regulation and the difficulties of maintaining millions of miles of aging pipeline infrastructure in their warnings about the dangers of spills, fires, and other accidents. And data from the federal government suggests such concerns should be taken seriously. Over the last twenty years, more than 9,000 significant pipeline-related incidents have taken place nationwide, according to data from the Pipeline and Hazardous Materials Safety Administration. The accidents have resulted in 548 deaths, 2,576 injuries, and over $8.5 billion in financial damages. (Not counted in this total are thousands of less “significant" pipeline-related malfunctions.)


Readers of this site will recall the calculations performed in a recent blog post regarding the amount of oil that could potentially be moved per day through the Dakota pipeline -- 19.7 million gallons per day!  That is no small amount.  Therefore, accidents like those described in the excerpt  result in large environmental costs and human costs (injuries) -- which will be commented on shortly.


As if the figures above were not enough to drive home the point surrounding the dangers associated with the transportation of oil in pipelines, he goes onto show evidence gathered in the form of graphs/plots of frequency of occurrence correlated with geography.  One snapshot of a plot appears like the following shown below tracking the growth of the pipeline spills over the last 30 years:


Source: George Joseph


The total costs of the spills dotted in the above image total to $8.5 billion over a 30 year period.  With that many miles of pipeline developed over a 30 year period, one cannot help but wonder what is the disaster/injury rate.  Below is a diagram taken from the same source detailing the number of incidents over a 30 year period from 1986-2016:


Source: George Joseph


Just last week, after the victory of the Sioux Tribe in getting a total Environmental Impact Report, the news did not report another pipeline break that was 200 miles from the Dakota protests.  In an article from the website 'EcoWatch' titled "Oil Pipeline Shut Down After Spill, Just 200 Miles From Standing Rock" the author lists a series or recent spills that have occurred with the company at fault in the last few years -- resulting in hundreds of thousands of gallons of oil being spilled.   One would ask the logical question:


Why do we continue to build oil pipelines in light of the disasters over the years?


Even when the disasters have such long term (and unknown) consequences to the environment.  The points made above do not take into account the tourism industry which suffers greatly as a result of any oil spill.  In a blog post I wrote last spring, I discuss the traditional 'California Dream' being destroyed by the operations of 'big oil.'  The effects of pipeline disasters are unknown and loom largely in the background -- which is why the last question is extremely important to consider repeatedly when the discussion of energy demand is on the table.


Of course, the default answer to the energy trade is the that the national demand drives our dependence on cheap fossil fuels rather than costly renewable energy.  I am not arguing against the fact that demand does drive the default (lowest cost) solution.  What I will propose is to build upon the existing pipeline (improve conditions) along with growth toward renewable energy.  Growing the renewable energy sector will demand a more intelligent workforce (which we have) and improve the conditions of working overall.  Let me explain below.


Grow Renewable Energy!


First, before we grow renewable energy, the existing oil and gas infrastructure needs to be approved upon.  When I was a graduate student at University of California at Riverside in the Chemistry department, I got to work closely with the machine shop.  Some of the machinists had come to work for the University after working along the pipeline in the North West of America -- Alaskan pipeline.


According to a welder, the work was tedious and not challenging since it was highly repetitive.  Although, I have met a number of people in my life who thrive in those conditions.  They love repetitive work.  Work the shift hard and then go home -- sounds like a perfect fit to me.  Which raises the following question:


Why can't we get workers back to work improving existing oil and gas pipeline?


According to the article cited above in 'The Atlantic,' there exists millions of miles of pipeline.


What a great fit?


Could you imagine the amount of jobs required to inspect and repair millions of miles of pipeline.  The number of hires needed would be in direct proportion to the time required to complete and upgrade our oil delivery system.  By update, I mean repair and make sure that the existing oil pipeline is in good shape.


Additionally, the employees could also install 'sensors' with accuracy to detect when the flow at a given point has changed dramatically.  Sensor technology has advanced quite a bit in the last couple of decades.  Piezo-electric technology has the ability to offer such solutions to the oil and gas industries to detect major changes.  In an article from the website "Scientific Computing" titled "Aviation Enhancements, Better Biosensors Could Result from New Sensor Technology" an update is given by the author on the state of piezo-electric technology by the following excerpt:


Piezoelectric sensors measure changes in pressure, acceleration, temperature, strain or force and are used in a vast array of devices important to everyday life. However, these sensors often can be limited by the "white noise" they detect that can give engineers and health care workers false readings. Now, a University of Missouri College of Engineering research team has developed methods to enhance piezoelectric sensing capabilities. Enhanced sensors could be used to improve aviation, detect structural damage in buildings and bridges, and boost the capabilities of health monitors.

Guoliang Huang, an associate professor of mechanical and aerospace engineering in the MU College of Engineering, and his team's new platform improves sensors by amplifying the signal, allowing the same amount of sensors to read more data. Their new device also cuts costs by allowing fewer sensors to cover larger structures and longer distances.


The author goes onto describe the changes from previous sensor technology.  Further, the sensors can be "tuned" to a specifically weak signals which would neglect other signals.  These sensors are an example of the type of technology appearing on the market that has been developed and is currently in use in a wide range of applications from aerospace to the biomedical field.   Understanding that the technology exists raises the following question:


Why is this technology not being deployed to prevent oil and gas spills?


This prospect would be beneficial to society and the world at large.  No one likes to see an economy that is adversely impacted by a large number of spills resulting in a large amount of environmental damage.  Moving toward a sustainable future is where the world is headed.  The question becomes then:


Is the current administration headed in the same direction?


Toward a more sustainable and healthy environment through the promotion of green energy?


Unfortunately, at the current moment with the announcement of reductions in climate funding and science funding overall, the direct seems to be counterintuitive to that of forward progress.  Not to worry though?  There exists powerful people (CEO) that are in charge of large corporations that can and are promoting change toward renewable energy.


Private Investment In Renewable Energy!


In addition to whatever funding is sought after to elevate the use of renewable energy in the future, a portion of that money will be inevitably from 'Private Sector' funding.  Years ago, I was watching a Charlie Rose interview with a rear Admiral who was explaining that funding sources occur in two different ways: either government funding or private sector funding.


At any given time, you can limit the source to either funding avenue.  Furthermore, he stated that the funding source can change between the initiation of the project and the end point of the project.  With the recent Paris Climate talks just completed (less than a year ago), there is enthusiasm on part of the private sector through an initiative called "Breakthrough Energy Ventures" spearheaded by top CEO's like Bill Gates.  This is encouraging.


Although with the news of the incoming administration's intention to back away from these environmentally friendly improvements, the Coalition has had to step up with a press release.  In an article from the website "Laboratory Equipment" titled "Billionaires Launch Massive Green Energy Fund to Spur Breakthroughs" the author introduces the Coalition's intention of elevating the renewable energy market by competitive bids.  Here is an excerpt describing the thought process behind the initiative:


Breakthrough Energy Ventures counts Bill Gates, Jeff Bezos, Jack Ma of Alibaba, Richard Branson of Virgin, Reid Hoffman of LinkedIn, and a handful of others among its board.
Their goal: to invest in new breakthroughs that have the potential to reduce greenhouse-gas emissions “by at least half a gigaton.”
That difference must be achieved across five areas, they said: electricity, transportation, agriculture, manufacturing and buildings.
“Some of these investments will result in ideas that move forward and some won’t; developing some may even make work on others unnecessary,” they said.
Together, the group’s combined total wealth is about $170 billion, according to Business Insider.
Ventures is part of a larger Coalition founded last year to inject private innovation and research dollars into new energy technologies. Government research alone will not solve the open-ended conundrum, they said. To find the solution, there are probably dead-ends that need to be investigated – perhaps at a net loss of capital.


As you can see by the names listed in the first paragraph -- the backers are 'heavy hitters'.  Very successful Chief Executives that have produced wealth and supported massive change in supply and demand areas in our economy over the years.  Their combined wealth is $170 billion -- WOW!


I state that the CEO's listed have produced massive wealth and changes in supply and demand.  One might be wondering what exactly I mean by this.  I will explain below.


By creating change in the way supply and demand exists in our world, these CEO's have literally transformed our society.  Think about the changes alone of just Jeff Bezos and Bill Gates.  Bill Gates has competitively changed our life as we know it with the products of Microsoft.  Not to mention the purchasing power that the online market offers with the addition of Amazon.  A person can order a variety of items (groceries, books, audio products, tech gadgets, etc.) with the push of a button using their distribution system.


Now, a person might be reading this blog post and cite the jobs lost as a result of technology change with the production/distribution lines in factories being lost to Robots.  I would argue that a loss of a job going to a Robot is a creating of a job going toward a renewable energy position.  'Work smarter not harder.'


Putting employees in high level jobs -- creating renewable energy -- would offer the new employees experience in operating data collection systems.  These systems that monitor the creation and distribution of energy would result in optimizing the system and reduce threats to the system over time.  The overall achievement would be to have unemployed people working and a more intelligent (more highly skilled) labor force.


Other CEO's listed above are spearheading 'green movements' on their own which enable them to join the coalition.  Sir Richard Branson has a large part of his business 'Virgin Atlantic' devoted to thinking sustainably.  Back in 2014, he purchased a 74-acre island (Necker Island) in the British Virin Islands and started thinking about powering the land solely by 'renewable energy.'  This thought process led to the creation of "The Carbon War Room" -- whose mission is stated in 2 minutes in the following video below:


As highlighted in the video above, the total thinking on behalf of companies has shifted toward a renewable energy based mindset. And as a result, there will be inevitably job creation as these new industries develop solutions to the challenge of reducing the carbon footprint by a gigaton per year.


What Does The Data Say?


In a recent study highlighted on the website "Science Daily" in an article titled "Natural gas and wind are the lowest-cost generation technologies for much of the U. S." a wonderful and positive result for the renewable energy industry was reported.  The study aimed to map the "Levelized Cost of Electricity" per county across the United States.


Result: wind and natural gas technologies stand out as the cheapest across the Nation!


How did the authors arrive at the conclusion?


What were the considerations in the study?


Here is an excerpt from the paper on 'Science Daily':


Researchers categorized the electricity system into three principal components: consumers; generation technologies; and the wires, poles, storage and other hardware required to connect end users and generators. Taken as a whole, the white papers assess the interaction among these three components, as well as costs often considered external to the electricity system, such as environmental effects and public health impacts.

"These are complex, interrelated issues that cannot be adequately addressed from one perspective," said Dr. Tom Edgar, director of the Energy Institute. "We assembled a cross-disciplinary team to provide a fuller understanding of these costs and their policy implications."

For the white paper on power generation costs, researchers used data from existing studies to enhance a formula known as the Levelized Cost of Electricity (LCOE). In addition to including public health impacts and environmental effects -- which the LCOE typically does not -- the research team used data to calculate county-specific costs for each technology.


Other considerations include:


The FCe- study examined numerous factors affecting the cost of electricity generation, including:
1)Power Plant Costs (both operating and capital costs)
2)Environmental and Health Costs (air quality, greenhouse gases)
3)Infrastructure Costs (transmission & distribution lines, rail, pipelines)
4)Fuel Cost (variability, full fuel cycle)
5)Integration of renewable and distributed energy resources
6)Energy Efficiency
7)Government financial support for electricity generation (subsidies)


This is just one of a few studies that have emerged with indisputable data showing that renewable energy is starting to become a prominent player in the energy market.  The 'white paper' for the study above can be found by clicking - here.  The diagram with low resolution of the different sources and their geographical location are shown below:


Source: 'Science Daily'


I will be the first person to admit that certain aspects of renewable energy have a distance to go before being realized.  A major obstacle to the generation of renewable energy is what to do with the energy afterward?  How do the energy companies deal with the tremendous amount of energy to be stored?  This is where battery technology could be further developed and optimized to fill in the gap.


Regardless, the data from the study above and others like it are promising and cannot be denied.  More on this subject in the future on this site.


Conclusion...


Renewable energy offers the opportunity for large job growth in the future according to the accounts above.  You don't have to believe me necessarily.  There are plenty of high-level CEO's discussing the possibility.  Which is great.  I am a huge proponent of the private sector contributing to 'science funding'.  In a blog post a few months ago, I wrote about how the supposed '1%' could give (in funding) to elevate science research.  As highlighted above by Mr. Bill Gates, the funding will be multi-faceted and long range down the line.  The process is not a short sprint, but a long marathon for the future of renewable energy production. 


As with any race or run, there must be a course to run (a plan), the proper protection (i.e., police) of the course during the run (Federal dollar protection - investment).  And there must be 'runners'.  In the paragraphs above, the 'runners' (Bill Gates, Jeff Bezos, Sir Richard Branson, etc.) do exist -- which is extremely encouraging.


Lets hope in closing that the support of the plan comes in by enlisting the federal government to back these projects up.  With the support of all entities, growth in the renewable market is not only possible, but jobs will be created in the process.  This will be directly in line with the President-elect's 'bringing jobs back' and 'making America great again' slogans.


Until next time, Have a great day!