Wednesday, October 26, 2016

How Deep Is One Of The World's Largest Wave Tanks?

Harnessing energy is a 'hot topic' in today's sustainable energy movement.  There exists a wide range of possibilities from wearable electronics (in clothing) to wave energy converters (WEC) that convert the mechanical energy of a wave into electrical energy -- that is usable to power electronics.  Recently, I was reading about new research being performed at the U.S. Navy's largest wave tanks in Bethesda, Maryland.  The width and length were given in the article.  As an easy exercise in comparison to other blog posts, I thought that we might explore the height (or the depth) of one of the world's largest wave tank below.


U.S. Navy Wave Tank


The United States Navy has an enormous wave tank located on the East coast in Bethesda, Maryland.  Recently, in an article from the website 'Lab Manager' an article appeared titled "Wave Energy Researchers Dive Deep to Advance Clean Energy Source" in which new research into improving the efficiency of wave energy converters was discussed.  Here is an excerpt from the article:


ALBUQUERQUE, N.M. — One of the biggest untapped clean energy sources on the planet—wave energy—could one day power millions of homes across the U.S. But more than a century after the first tests of the power of ocean waves, it is still one of the hardest energy sources to capture.

Now, engineers at Sandia National Laboratories are conducting the largest model-scale wave energy testing of its kind to improve the performance of wave-energy converters (WECs). The project is taking place at the U.S. Navy’s Maneuvering and Sea Keeping facility at the Carderock Division in Bethesda, Maryland, one of the largest wave tanks in the world at 360 feet long and 240 feet wide and able to hold 12 million gallons of water.


After reading this excerpt, one should pause to put the research into context by asking the following questions:


How large of area is needed to properly explore the use of new technology in capturing wave energy?


Is the area mentioned above appropriate to represent the development of such technology?


How deep is such a large wave tank?


The answer to the first is an open ended answer to which researchers probably could continue to expand by building larger facilities to explore the development of such technologies.  Although, the funding for research must be present.  What does the wave tank look like?  Here is a video explaining the operation of this massive research wave tank shown below (less than 6 minutes):


As you can see, this is an amazing research facility of great importance.  To be able to acquire detailed information about objects in the ocean is super important.  The range of research projects that are possible to explore within the facility is far reaching.  Each of us could easily think up investigations that could be carried out in such a large tank.  Further, as explained in the video -- to be able to make "any type of wave" in the world is important too.  My mind was blown after watching this video of the facility.  With the rise of the information age, a facility like this is at the tip of the iceberg in terms of producing valuable data.


But returning to the questions posed after the excerpt in the article above, lets now move to the height of such a tank.  How high are the walls?  What is an appropriate height for such a facility?  Especially when considering the wide variety of waves in the world.  In the excerpt, the total volume of 12 million gallons was stated as were the dimensions (area) of the area of the wave tank.  Left out was the height of the tank.  Why?  I don't know.  After reading the values of the area, I had to compute the height.  The calculations are shown below.


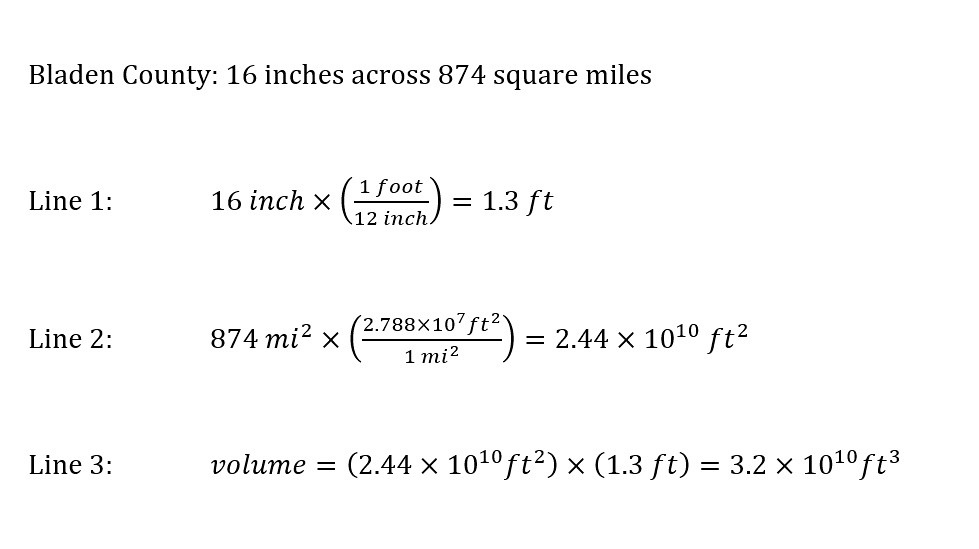
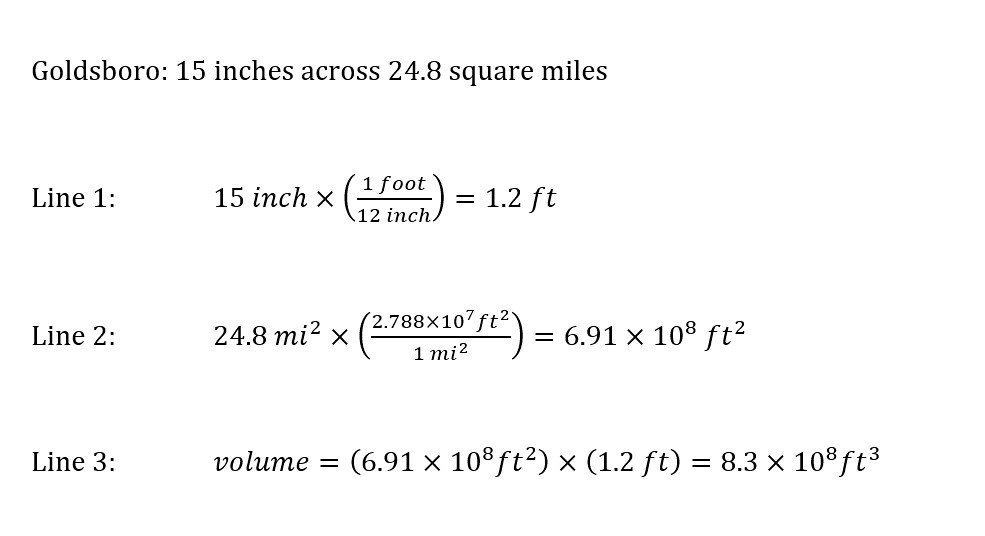
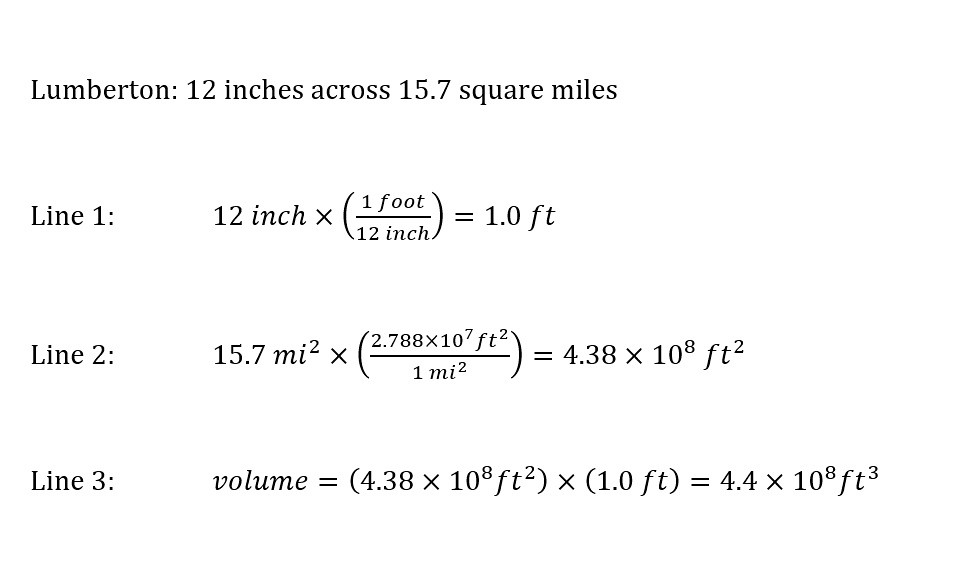
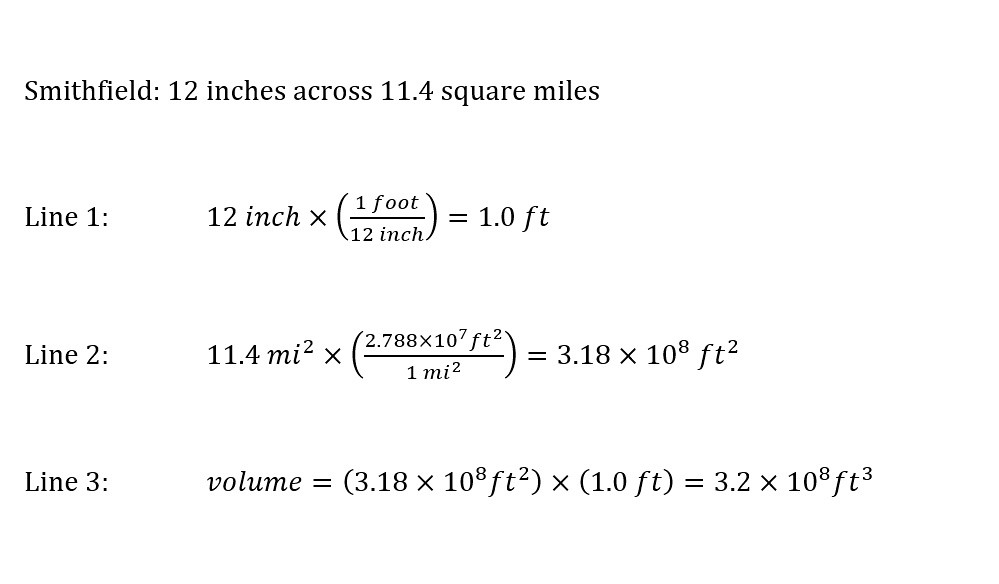
To start with, a couple of equations are needed.  The first equation is for the volume of the wave tank.  According to the article, the tank is the shape of a rectangle.  Therefore, the appropriate expression for the volume of the wave tank is given below:


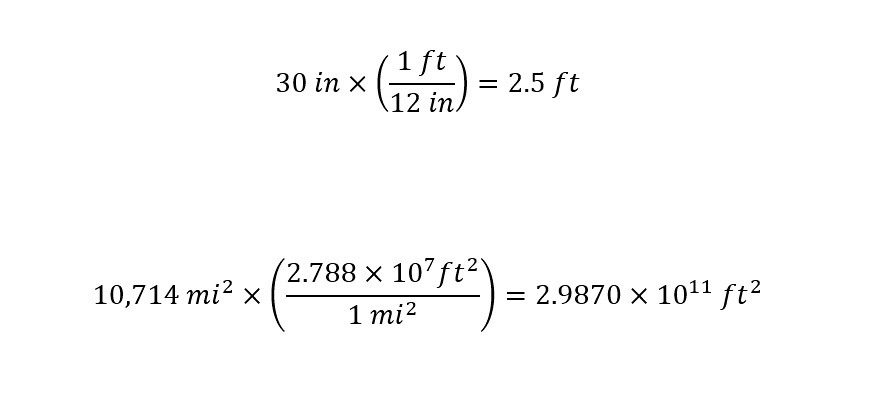
The volume was stated as 12 million gallons in the excerpt above while the area of the wave tank is given in units of 'feet.'  In order to compute a height in 'feet' from a volume expressed in units of 'gallons' -- a unit conversion step will have to be shown.  To convert from gallon to cubic feet, the conversion factor is given along with the setup for the calculation:


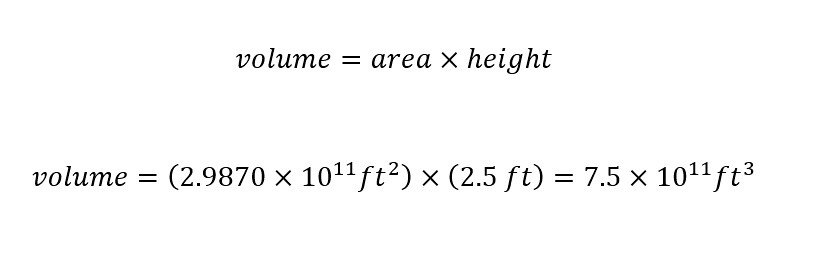
With the volume now expressed in units of 'feet' rather than 'gallons,' the values can be inserted into the original expression (equation) for the volume of a rectangle as shown below:


Upon first glance, the numbers inserted into the expression for the volume of a rectangle might look confusing at first.  Remember, the length and width of the wave tank were given along with the total volume.  The difference is the conversion from units of 'gallons' to 'cubic feet' -- which is confusing to a large amount of readers.  What is important to note is that the result of the calculation is expressed in the desired units -- feet.  Everything adds up -- which is great.  Now to compare to the actual value.


How does the calculated height compare with the actual height of the wave tank built by the U.S. Navy?


Below is a short time lapse video of the construction of the enormous wave tank mentioned above:


At first sight, the height of the wall seems higher than 18 feet.  In fact, according to an article in 'popular mechanics' the actual height is 20 feet tall.  Aha! As you can see the heights are comparable (18 feet calculated to 20 feet actual).  Using the equation for the volume of a rectangle is approximately accurate.  The actual shape of the basin has curved edges -- which if the rectangle had similar edges the height would increase.


The wave tanks mentioned above are research wave tanks.  Additionally, the wave tank mentioned in the title holds the record for being the 'second largest wave tank' in the world.  What wave tank holds the largest world record in size?  Find out below...


The World's Largest Wave Tank


The award for the world's largest wave tank goes to the Country Holland.  Here is a video of the world's largest wave tank shown below:


According the 'Guiness Book of World Records,' the largest wave pool is located in Thailand at the Siam Park City water park.  Here is a short video of the documented largest wave pool in the world below:


Notice how the shapes of the two wave tanks above are completely different.  This is due to the different purposes each serve.  In the first wave tank, from Holland, the research is dedicated to isolating a wave of varying lengths and hammering down the mechanics of formation and break.  Whereas the second wave tank was built purely for pleasure.


Children and adults are bouncing up and down and conducting personal experiments with the waves produced.  The different shape fits the purpose.  In the second case, the purpose is to fill the wave tank with as many people as possible.  Some on rafts and others just swimming among the waves for recreation.


Supposedly, in the near future (less than 2 years), Los Angeles will be home to the world's largest wave tank.  That remains to be seen though.


Conclusion...


For now, we can call the end of the blog at the present length.  For the future, you might want to compare the relative volumes of water held in each of the large wave tanks.  As I mentioned above, the tanks above span a range of different geometries and capacities.  Additionally, each of the above wave tanks serve a unique purpose.  Some are for recreation whereas others are critical to the billions of dollars spent on our U.S. Military.


The insight that is possible from an experimental standpoint cannot be overstated.  Further the importance of such research is critical to reducing the loss of life along with producing more efficient technology for the future.  Wave tanks offer a unique perspective into the amazing vast ocean that each of us confront when visiting the beach.  Performing research at the scale of the ocean is way too costly and dangerous.  The above efforts display the time and thought that is involved in such research.  Careful researchers are improving our lives by researching the prospect of renewable energy and saving large amounts of money in the process.


The next time that you find yourself either at the ocean or the local water park in the waves, take a few minutes and think about the amazing technological developments that science creates to make your lives better.  Until next time, cheers!


Friday, October 21, 2016

How Do We See The Invisible (sub-atomic particles) In The Visible Region?

How is the invisible to the naked eye made visible to the naked eye?  Today, with the advancement of technologies many can view the invisible into the visible region through a microscope.  An electron  microscope allows us to see molecular frameworks with the use of electrons -- amazing.  Other forms of measurement involve indirect detection like looking for a "green fluorescent protein"(GFP) tag which lights up when a given expression or event occurs.  Of course, in the last case, the sample has to be exposed to light in order for the GFP tag to fluoresce.


The radioactive decay of the element Radon can be made visible through the use of a "Cloud Chamber."  Recently, I ran across a video demonstrating the visibility of radioactive decay and could not stop thinking about how cool the demonstration was.  Therefore,  I decided to share the demonstration with you.  Additionally, I will draw parallels with the "trails" that are visible after flying aircraft leave the sky.


Visualizing Radiative Decay!


Most of us have an idea of what radioactivity is - right?  Something along the lines of 'sub-atomic' particles being given off which are highly energetic?  Sound familiar?  Maybe not.  Lets consult our good friend 'Wikipedia' to help us out with a definition of 'radioactive decay'.  Here is an excerpt:


Radioactive decay (also known as nuclear decay or radioactivity) is the process by which the nucleus of an unstable atom loses energy by emitting radiation, including alpha particles, beta particles, gamma rays, and conversion electrons. A material that spontaneously emits such radiation is considered radioactive.
Radioactive decay is a stochastic (i.e. random) process at the level of single atoms, in that, according to quantum theory, it is impossible to predict when a particular atom will decay,[1][2][3][4] regardless of how long the atom has existed. For a collection of atoms however, the collection's decay rate can be calculated from their measured decay constants or half-lives. This is the basis of radiometric dating. The half-lives of radioactive atoms have no known lower or upper limit, spanning a time range of over 55 orders of magnitude, from nearly instantaneous to far longer than the age of the universe. A radioactive source emits its decay products isotropically (all directions and without bias)[5] in the absence of external influence.


Couple the description above to the picture below to get a full visualization:


Source: Inductiveload


How does a person measure radiation decay?


Hollywood offers a visual representation commonly depicted in movies surrounding the release of a 'nuclear weapon' or threat of exposure to radioactive compounds like the following shown below:


A common instrument used to measure the amount of radiation that is being emitted off of a given sample is the 'Geiger Counter' and is shown below:


Source: TimVickers 


The instrument can sample a range of intensities.  But, what if the radiation that we are trying to measure is that of the natural background from the sky.  The background radiation is supposedly orders of magnitude than a release of a 'nuclear weapon' (which is true).


How does a scientist measure background radiation?


How about using a cloud chamber?


An instrument that is commonly used to measure radiation is called the 'Cloud Chamber' or 'Wilson Chamber' after the founder -- the Scottish physicist Charles Thomson Rees Wilson.   The structure of a cloud chamber is relatively simple.  A chamber is couple with a heater/cooler which has access to introduce a radioactive source into the interior space.  This will be demonstrated in the video below.  A picture of a cloud chamber from 'Wikipedia' is shown below:


Source: Cloudylabs


They are easily constructed and instructions for science projects involving the construction of a 'Cloud Chamber' can be found here.


As I mentioned in the introduction, I found a video which showed precisely and beautifully the radioactive decay of various elements.  The video on 'YouTube' is titled "Large Diffusion Cloud Chamber With Radon Gas Double-Decaying" and is broken down into frames below.  During frames, I commented or narrated on the content in each frame.  The overall message to take home from viewing the frames below is that the video allows us to see atoms precisely in their position from the 'alpha decay' leaving the nucleus.  The demonstration is absolutely amazing.


One more note is that the chamber is cooled at the bottom and heated slightly at the top to produce a temperature gradient.  The temperature gradient is similar to the temperature gradient in the sky as one goes to higher altitudes.  Therefore, after I show the video frames, I will draw an analogy with the "trails" from condensation commonly seen after an airplane flies across the sky.


First, lets start with a frame from the video which shows the chamber without any radioactive compound inserted.  As shown below, this is the natural background radiation that each of us are experiencing without noticing it at any given moment.


Background Radiation:


Relatively few interactions compared to the expected large amount of a concentrated decay like a 'nuclear weapon' or a 'radioactive source'.


Point Source:


Right after exposure to the cloud chamber.  Notice initially, there is a huge force of alpha decay pushing out from the source toward the other side of the chamber.  The pressure wave of alpha decay resembles the shape of the source -- a half spherical shape -- as shown below.


Point Source - 3 seconds after:


Notice the exponential diffusion of particles throughout the chamber. After a series of collisions producing further alpha decays, the motion becomes unpredictable -- as shown below.


Point Source - 9 seconds:


Still going.  Actually, the secondary decay is occurring at this moment.  The picture below shows the extent of the energetic alpha particles still colliding with more nuclei to produce (secondary) radioactive decay -- as shown still below.


Point Source - 19 seconds:


Crazy!  I wonder how long the team had to wait until the entire chamber came back to equilibrium.  The state of equilibrium would have resembled the 'background' still frame above.


Visualizing Temperature Gradients!


In the last section, the amazing demonstration of 'alpha' radioactive decay was made clear using a cloud chamber filled with ethanol gas.  I pointed out before presenting the 'still frames' of the diffusion of radiation that there exists an equivalent analogous situation that occurs on the 'macroscale'.  Not only does the event happen on the scale of everyday occurrences, the event is visible to a large audience of viewers from the ground.


The idea of 'chemtrails' is a popular conspiracy put forth to account for the seeming long white trails which follow an aircraft traversing the sky.  Here is an excerpt to describe such phenomenon taken from the 'Wikipedia' page on 'Chemtrails':


Chemtrail conspiracy theory is an unproven suspicion that long-lasting trails, so-called "chemtrails", are left in the sky by high-flying aircraft and that they consist of chemical or biological agents deliberately sprayed for sinister purposes undisclosed to the general public.[1] Believers in the theory argue that normal contrails dissipate relatively quickly and that contrails that do not dissipate must contain additional substances.[2][3] These arguments have been dismissed by the scientific community: such trails are normal water-based contrails (condensation trails) that are routinely left by high-flying aircraft under certain atmospheric conditions.[4] Although proponents have attempted to prove that the claimed chemical spraying does take place, their analyses have been flawed or based on misconceptions.[5][6]
Because of the widespread popularity of the conspiracy theory, official agencies have received many inquiries from people demanding an explanation.[2] Scientists and government officials around the world have repeatedly needed to confirm that supposed chemtrails are in fact normal contrails.[7]


With the corresponding visual description taken also from the 'Wikipedia' page for 'chemtrails' shown below:


Source: No machine


The conspiracy theorists are fascinating in their endeavor to seek an answer to this phenomenon.  Implying that the government is actively pursuing dumping chemicals into the environment in order to create such trails is non-sense.  Any particle growth with water vapor in the atmosphere will diffract light -- look at clouds.


The real culprit in the case of the so called 'trails' across the sky come from 'contrails' -- short for condensation trails -- made up of water vapor that has crystallized.  Here is the description from 'Wikipedia' for 'contrails' below:


Contrails (/ˈkɒntreɪlz/; short for "condensation trails") or vapor trails are line-shaped clouds sometimes produced by aircraft engine exhaust, typically at aircraft cruise altitudes several miles above the Earth's surface. Contrails are composed primarily of water, in the form of ice crystals. The combination of water vapor in aircraft engine exhaust and the low ambient temperatures that often exists at these high altitudes allows the formation of the trails. Impurities in the jet exhaust from the fuel, including sulfur compounds (0.05% by weight in jet fuel) provide some of the particles that can serve as sites for water droplet growth in the exhaust and, if water droplets form, they might freeze to form ice particles that compose a contrail.[1] Their formation can also be triggered by changes in air pressure in wingtip vortices or in the air over the entire wing surface.[2]
Depending on the temperature and humidity at the altitude the contrails form, they may be visible for only a few seconds or minutes, or may persist for hours and spread to be several miles wide, eventually resembling natural cirrus or altocumulus clouds.[1] Persistent contrails are of particular interest to scientists because they increase the cloudiness of the atmosphere.[1] The resulting cloud forms may resemble cirrus, cirrocumulus, or cirrostratus, and are sometimes called cirrus aviaticus. Persistent spreading contrails are thought by some, without overwhelming scientific proof, to have a significant effect on global climate.[3][4] Persistent contrails are sometimes called chemtrails in reference to the conspiracy theory regarding the undisclosed spraying of chemical or biological agents by various high-flying aircraft.


Again, as I just mentioned -- the crystals grow from water vapor attaching themselves to a 'seed molecule' and growing to the point of diffracting light.  I will give you a little known fact about 'contrails' that is not commonly known by the world.  This is in regards to the aircraft that you see at airshows.  Now that you know that the condensation has a role to play with 'contrails' -- you might be wondering the following question -- regarding air shows with fighter jets:


How do the jets make 'contrails' at a precisely given point in space in the sky?


The answer lies in the fact that the gun bay in a fighter jet where the ammunition is stored is emptied out -- for show jets.  In the space (gun bay), there is an oil container filled with oil.  There is a delivery system (via veins or tubes) that deliver the oil onto the exhaust of the jets to produce a 'contrail'.


Bet you did not know that!


Conclusion!


The ability to view the invisible is absolutely amazing.  In the paragraphs above, the size of the particle that has been shown to be visible spans from the sub-atomic of a radon nucleus to the particles (aggregates of ice crystals) in the sky.  When we look up and see a cloud, that is evidence of a particle grown from a 'seed molecule' with water vapor.  The diffraction of light gives way to the opaque (cloud) that is seen in the sky above.


Whereas, on the sub-atomic scale, the ejection of an alpha particle decaying off of a nucleus is seen as the trail from the thermal gradient.  Each is a representation of an indirect interaction.  Science offers us an explanation to a wide range of such situations.  Further, with these explanations, better decisions regarding science policy are possible in government.  Ranging from the international level to the local level, science plays a large role in the decisions.  If it does not, maybe in the future it should.  Having examples like the two above, give us an idea regarding the safety of radiation and chemicals in the sky.


Until next time, Have a great day!


Wednesday, October 12, 2016

Unraveling The Resistance Of Antibiotics!

Stories seem to emerge daily regarding the threat to the human race regarding the rise in resistance of antibiotics toward common diseases.  One side of the spectrum, the pro-antibiotic sector are dispersing antibiotics like candy to farm animals and patients without caution.  Whereas on the other side of the spectrum, there is a growing community of researchers, advocates, and concerned citizens -- yelling at the top of their voices to stop administering antibiotics needlessly.  With both sides of the spectrum known, the following question emerges naturally:


Where is scientific research at on the issue?


Are advancements in discovery being made to deal with the potential threat?


The short answer is that the discovery process takes time and is complicated.  Which is no answer at all.  Whereas the long term solution involves research being done.  As I explained in a previous post on drug discovery, research advances are arduous and take time.  Recently, though, progress has been reported in the scientific community and worth giving a "shout out" about.  Below is the short post regarding the advance.


Antibiotic Resistance?


Yes, whenever I hear about antibiotic resistance, I stop and pause for a moment of scare.  Then I think about the progress that is being made (hopefully).  I cannot have myself worry too much about the issue since I do not perform research directly toward a solution.  Although, I can support students who are biochemistry undergraduates and graduate students while educating them on the need and importance of such research.  Couple that with a proper training on the scientific instrument needed to perform the research and my job ends there.


Sounds scary right?


Well, not all is held in limbo with regard to antibiotic resistance.


First, what is antibiotic resistance?  In order to understand the issue, what is the problem?


Here is an excerpt taken from the 'Wikipedia' page for "Antibiotic Resistance" is shown below:


Antimicrobial resistance (AMR) is the ability of a microbe to resist the effects of medication previously used to treat them.[2][3][4] This broader term also covers antibiotic resistance, which applies to bacteria and antibiotics.[3] Resistance arises through one of three ways: natural resistance in certain types of bacteria; genetic mutation; or by one species acquiring resistance from another.[5] Resistance can appear spontaneously because of random mutations; or more commonly following gradual buildup over time, and because of misuse of antibiotics or antimicrobials.[6] Resistant microbes are increasingly difficult to treat, requiring alternative medications or higher doses—which may be more costly or more toxic. Microbes resistant to multiple antimicrobials are called multidrug resistant (MDR); or sometimes superbugs.[7] Antimicrobial resistance is on the rise with millions of deaths every year.[8] A few infections are now completely untreatable because of resistance. All classes of microbes develop resistance (fungi, antifungal resistance; viruses, antiviral resistance; protozoa, antiprotozoal resistance; bacteria, antibiotic resistance).
Antibiotics should only be used when needed as prescribed by health professionals.[9] The prescriber should closely adhere to the five rights of drug administration: the right patient, the right drug, the right dose, the right route, and the right time.[10] Narrow-spectrum antibiotics are preferred over broad-spectrum antibiotics when possible, as effectively and accurately targeting specific organisms is less likely to cause resistance.[11] Cultures should be taken before treatment when indicated and treatment potentially changed based on the susceptibility report.[12][13] For people who take these medications at home, education about proper use is essential. Health care providers can minimize spread of resistant infections by use of proper sanitation: including handwashing and disinfecting between patients; and should encourage the same of the patient, visitors, and family members.[12]
Rising drug resistance can be attributed to three causes use of antibiotics: in the human population; in the animal population; and spread of resistant strains between human or non-human sources.[6] Antibiotics increase selective pressure in bacterial populations, causing vulnerable bacteria to die—this increases the percentage of resistant bacteria which continue growing. With resistance to antibiotics becoming more common there is greater need for alternative treatments. Calls for new antibiotic therapies have been issued, but new drug-development is becoming rarer.[14] There are multiple national and international monitoring programs for drug-resistant threats. Examples of drug-resistant bacteria included in this program are: methicillin-resistant Staphylococcus aureus (MRSA), vancomycin-resistant S. aureus (VRSA), extended spectrum beta-lactamase (ESBL), vancomycin-resistant Enterococcus (VRE), multidrug-resistant A. baumannii (MRAB).[15]
A World Health Organization (WHO) report released April 2014 stated, "this serious threat is no longer a prediction for the future, it is happening right now in every region of the world and has the potential to affect anyone, of any age, in any country. Antibiotic resistance—when bacteria change so antibiotics no longer work in people who need them to treat infections—is now a major threat to public health."[16] Increasing public calls for global collective action to address the threat include proposals for international treaties on antimicrobial resistance.[17] Worldwide antibiotic resistance is not fully mapped, but poorer countries with weak healthcare systems are more affected.[9] According to the Centers for Disease Control and Prevention: "Each year in the United States, at least 2 million people become infected with bacteria that are resistant to antibiotics and at least 23,000 people die each year as a direct result of these infections." [18]


Is that a comprehensive definition?


Instead, why not start with a simple pictorial representation of what antimicrobial resistance is.  In a previous post on the need for greater science communication, Dr. Tyler Dewitt gave a great explanation of the modes of how virus's and bacteria invade a host organism like the human body.  I suggest taking a look at the post.  Once the invader (virus or bacteria) enters the system, the invader takes hold (control) of your system.  The control allows the invader to make several copies of itself to proliferate and grow to become a problem (onset of disease).


What can be done about such a state?


One methodology that has become increasingly common if the invader is a microbe or bacteria is to administer antibiotics which wipe out the infection.  Shown below is a picture taken from the 'Wikipedia' page again for clarity to illustrate the point of action of antibiotics:


Source:By NIAID – NIH


The image above is very simple to understand the action of an antibiotic.


Advances In Antibiotic Resistance


Recently, there has been advances in research surrounding antibiotic resistance that may speed up the ability to deal with the looming threat.  In an article from the website 'Sciencedaily.com' titled "Mystery of bacteria's antibiotic resistance unravelled" new developments have been made in unraveling the mode of disabling the effect of antibiotics by researchers.  Here is an excerpt discussing the advancement:


One of the mechanisms leading to rifampicin's resistance is the action of the enzyme Rifampicin monooxygenase.

Pablo Sobrado, a professor of biochemistry in the College of Agriculture and Life Sciences, and his team used a special technique called X-ray crystallography to describe the structure of this enzyme. They also reported the biochemical studies that allow them to determine the mechanisms by which the enzyme deactivates this important antibiotic.

The results were published in the Journal of Biological Chemistry and PLOS One, respectively.

"In collaboration with Professor Jack Tanner at the University of Missouri and his postdoc, Dr. Li-Kai Liu, we have solved the structure of the enzyme bound to the antibiotic," said Sobrado, who is affiliated with the Fralin Life Science Institute and the Virginia Tech Center for Drug Discovery. "The work by Heba, a visiting graduate student from Egypt, has provided detailed information about the mechanism of action and about the family of enzymes that this enzyme belongs to. This is all-important for drug design."


 Before I make a few comments on the success of the discovery in the pipeline to a marketable drug or treatment, I would like to add another excerpt from the same article highlighting the importance of the antibiotic rifampicin is to an array of diseases:


Rifampicin, also known as Rifampin, has been used to treat bacterial infections for more than 40 years. It works by preventing the bacteria from making RNA, a step necessary for growth.

The enzyme, Rifampicin monooxygenase, is a flavoenzyme -- a family of enzymes that catalyze chemical reactions that are essential for microbial survival. These latest findings represent the first detailed biochemical characterization of a flavoenzyme involved in antibiotic resistance, according to the authors.

Tuberculosis, leprosy, and Legionnaire's disease are infections caused by different species of bacteria. While treatable, the diseases pose a threat to children, the elderly, people in developing countries without access to adequate health care, and people with compromised immune systems.


As you can see, the ability of the antibiotic rifampicin to knock out an array of important diseases cannot be overstated.  Therefore, any advancement in understanding modes of action or in this case 'inaction' are critical to drug designers for the future.  At this point, you might be wondering what the structure of rifampicin looks like?  Shown below is the chemical structure of rifampicin take from 'Wikipedia':


Rifampicin

Source of image: By Vaccinationist - Rifampicin on PubChem


With the discovery of the mechanism by which Rifampicin Monooxygenase deactivates rifampicin's ability to act as an antibiotic, should we all throw our hands up and celebrate?


The discovery of the deactivation mechanism of rifampicin is a major step for drug makers in producing new lines of antibiotics in the future.  As I mentioned in a previous blog on drug discovery, the flow of patentable drug includes discoveries made at the university level.  This discovery certainly qualifies as one -- certainly.  Although, more studies will have to be followed up in order to realize the discovery into a better antibiotic in the future.


I should mention one major point of contention about the discovery of the mechanism.  The spectroscopic technique that was used was x-ray crystallography.   X-ray crystallography as a technique just celebrated it't 100th year since the discovery of the technique.  Here is an excerpt from the 'Wikipedia' page describing the technique of 'x-ray crystallography':


X-ray crystallography is a tool used for identifying the atomic and molecular structure of a crystal, in which the crystalline atoms cause a beam of incident X-rays to diffract into many specific directions. By measuring the angles and intensities of these diffracted beams, a crystallographer can produce a three-dimensional picture of the density of electrons within the crystal. From this electron density, the mean positions of the atoms in the crystal can be determined, as well as their chemical bonds, their disorder and various other information.
Since many materials can form crystals—such as salts, metals, minerals, semiconductors, as well as various inorganic, organic and biological molecules—X-ray crystallography has been fundamental in the development of many scientific fields. In its first decades of use, this method determined the size of atoms, the lengths and types of chemical bonds, and the atomic-scale differences among various materials, especially minerals and alloys. The method also revealed the structure and function of many biological molecules, including vitamins, drugs, proteins and nucleic acids such as DNA. X-ray crystallography is still the chief method for characterizing the atomic structure of new materials and in discerning materials that appear similar by other experiments. X-ray crystal structures can also account for unusual electronic or elastic properties of a material, shed light on chemical interactions and processes, or serve as the basis for designing pharmaceuticals against diseases.


The spectroscopic technique is very powerful and is commonly used in a wide range of areas of research for structural determination.  One drawback is the constraint of having to grow a crystal -- a rather large crystal to subject the x-rays to in order to obtain a diffraction pattern.


Why does this matter?


One commonly held belief among spectroscopists is that x-ray crystallography is extremely useful in a range of areas as a first step or a confirmation step.  The constraint of having to grow a crystal is also a large point of contention regarding the usefulness of the information obtained by the diffraction pattern.  Why?


The reason is centered around the fact that processes in the body (i.e., at physiological conditions) are performed in a 'liquid-state' rather than a 'crystalline-state' (i.e., solid state).  Scientists argue about the true degree of accuracy of a structure obtained by x-ray crystallography rather than say a structure obtained by nuclear magnetic resonance (NMR) in the liquid state.  The structure obtained by NMR is believed to be more representative of the actual conditions (liquid state, pH, temperature, etc.).


Nevertheless, the discovery above is extremely important.  The realization of a site of deactivation for rifampicin monooxygenase can now be further explored and compared to other antibiotics.  Scientists in industry and academia (university settings) will use incorporate this mechanism into their current understanding and models to produce a better antibiotic.


Further, understanding 'antimicrobial resistance' is a hot topic.  Just today, the 'Los Angeles Times' published an editorial discussing two bills that are hitting legislature for consideration.  Lets hope the combined efforts of all of these actions, leads to fewer cases of deaths in hospitals along with safer and better antibiotics.


Conclusion...


Should we be celebrating?


The advancement discussed above is cause to celebrate momentarily. Although, as I mentioned in the previous post regarding the drug discovery process, the path is long and arduous. Advancements such as these improve the ability of researchers to add another piece to the puzzle. Given more information, further advances can be pushed even further. Of course, that goes without being said (i.e., thank you captain obvious). Research is a long process and needs a lot of funding and time to test and retest procedures to make sure that scientists get the process right -- to eliminate the problem the first time around. Adjustments often have to be made due to inefficiencies of a given treatment or terrible side effects. Although, with a better understanding of the mode of action and inaction, drug manufacturers create more accurate drugs and research is one step further in understanding how nature operates to take control over our immune systems or subject us to terrible diseases.


Last but not least, the overall importance of writing a post like this is to convey the excitement and importance of such research. To demystify the meaning of "antibiotic resistance" or "antimicrobial resistance." Raising awareness of the magnitude of the issue will hopefully rally support on part of the public (your support) to elevate the need for funding and research into such issues. Do your part. Advocate for science and educate yourself on the successes and challenges (failures, obstacles). Give us some feedback.


Until next time, have a wonderful day!


Sunday, October 9, 2016

How Much Rain Did The East Coast Receive From Hurricane Matthew?

News reports are surfacing everywhere on Twitter (and other social media outlets) discussing the devastation that Hurricane Matthew has brought to the East Coast.  Below is one example from the news site 'NBC News':


The devastation is without question.  What is questionable is the preparation of emergency agencies based on knowledge a few days (weeks) earlier with the disaster that unfolded in Haiti.  Haiti received an enormous amount rain -- which I wrote a blog about last week.  The amount of rain was so large that the summer storm in China which received a whopping 580 billion cubic feet was eclipsed by 750 cubic feet of rain.


Using the same approximations (land area, average rainfall, etc.), lets calculate the amount of rain that the East Coast has received to get a better grasp on the terrible Hurricane Matthew that has ripped apart and drenched parts of the world.


East Coast Receives Rain


As if the devastation to Haiti was not enough to contend with.  But Hurricane Matthew continued to drive up into the United States.  Various news accounts have given numbers which allow us to approximate and estimate through dimensional analysis the terrible amount of rain that have plagued regions.


To accurately assess the total volume of rain that has dropped on the entire East Coast as a result of Hurricane Matthew, each of the weather stations would have to report an average amount of rainfall across their respective region.  Not every region has the capability or funding to do so unfortunately.  Therefore, we have to rely and approximate based on whatever values are reported.  Hopefully, in the future, this disparity will change and weather prediction and storm forecasting will benefit to a large extent from such positive change.   The example I will use below is of the tremendous amount of rainfall that has hit the state of North Carolina in the last few days.


According to the news site 'NBC News' in an article titled "U.S. Death Toll From Hurricane Matthew Rises to 17 Across Four States" reports were given of amounts of rain (listed in inches) fall to various regions:


By Saturday night, rainfall totals were 16 inches in Bladen County, 15 inches in Goldsboro, 12 inches in Lumberton and Smithfield, and 9 inches in Raleigh and Rocky Mount, McCrory said in a statement.


After reading the above statement regarding the amount of rain that fell on various counties in North Carolina, you might not be shocked.  Picture says thousands of words.  Remember that rain was not the only component that made up the devastating impact of Hurricane Matthew.  The other destructive component was the wind factor with speeds reaching into a hundred miles per hour in some places.


Compounding the destruction from rainfall alone, the wind can add to the destruction by imposing a force to be reckoned with.  Below is a video (just over a minute) from 'YouTube' to illustrate my point:


Watching the video above really drives home the destructive power of wind.  Too often, people watching the storm from a television cannot comprehend the effect of wind in a given storm.  Although, after rain has fallen or in combination with, wind can have very devastating and destructive effects on a given geographic area.  Especially, if the area is not built to receive that much rain.  This was the case with a storm in Elliot City (Maryland) earlier this year.


In order to understand the extent of the damage, a few calculations can be performed.  As I mentioned above, we can use the logic and approximations that we have assumed in earlier posts on this site.  First, we can find out the geographic area by looking in the 'Wikipedia' sites for the counties and regions listed in the excerpt above.  Using the same methodology as in previous blog posts of calculating a volume from the product of the area (geographic land mass area) and the height (of rain fall), a total volume will result from our efforts using the expression below:


I will list the area (in square miles) and height (in inches of rainfall).  After performing the conversion of square miles to square feet along with converting inches into feet, a final calculation can be performed. We can plug the values directly into the expression to obtain a volume.


Six regions were listed in the excerpt above: Bladen County (874 square miles), Goldsboro (24.8 square miles), Lumberton (15.7 square miles), Smithfield (11.4 square miles), Raleigh (142.8 square miles), and Rocky Mount (43.8 square miles).  It is important to note that each of these regions have a water component that was not included in the geographical area calculation.  This would increase the area of each region.  Additionally, the water component exacerbates the effects of a Hurricane like Hurricane Matthews.


Again, the outline of the calculations below will be as follows:


1) Line 1: Conversion of units of rainfall - from inches to feet.


2) Line 2: Conversion of units of land area - from square miles to square feet.


3) Line 3: Volume of rainfall - land Area multiplied by Height of rainfall.


With the values and order of calculations/conversions listed above, we can now calculate a volume for each region as shown below:


The volumes listed above are enormous in magnitude which are based on the reporting of the devastating effect of Hurricane Matthew in North Carolina.  As I mentioned above, the state of North Carolina has waterways dispersed throughout the state as illustrated below from 'Wikipedia':


Source: Alexrk2


The East Coast has received an amount of rain that has so far claimed the lives of 18 people (in North Carolina).  Understanding the magnitude of such disasters gives the reader an idea of the force of destruction that such disasters bring with them.  The news cycle is short compared with the long-term recovery process of natural disasters.  The need for accurate reporting and transparency is critical to convey the need for greater infrastructure for future disasters.  Disaster preparation is achieved through transparency and education.


Just in the last six months, the world has seen rainfall that is beyond comprehension in various areas of the US and beyond.  In the paragraphs below, I decided to illustrate the natural disasters in a different light.  The metric I have chosen is appropriate to some degree to illustrate the large volume of rain that has so far fallen on the East Coast.


How Many 'World Largest Pools' Could Be Filled?


The values reported above are enormous.  Well into the billions of cubic feet of rain have dropped onto North Carolina.  If the volume of rain that has dropped onto the six regions is accurately representative of the total rainfall that has dropped onto the entire East Coast, then the total amount is just simply incomprehensible -- to say the least.


When such enormous amounts of volumes are encountered, an appropriate metric is the "World's Largest Pool."  This giant structure has been used frequently on this site -- starting with the first time last year.  Two pictures are shown below for a reference from the website 'Huffington Post':


And ...


Source: Huffington Post


The total volume of this mega structure that has the title of the "World's Largest Pool" is a whopping 60 million gallons.  Yes, you read correctly.  In the image above, a sail boat is shown in the middle.  Alternatively, there are hotel structures in the first image to give a reference to the size of amazing feat.


If we wanted to calculate the amount of rain in each region mentioned above in North Carolina during Hurricane Matthew, we could easily.  First, each volume would have to be converted from cubic feet to gallons.  The conversion would allow us to directly compare each volume as an integer value.  That is the ratio would be expressed as an integer value of the "World's Largest Pool."  From here on out, the "World's Largest Pool" will be abbreviated to "WLP".


Without further ado, lets figure out how many of the WLP could be filled with the respective volumes of rain.  One example calculation will be shown for the region of Bladen County in North Carolina.  All other volumes will be displayed in a table after.


Just when you think that the numbers cannot get any larger, casting the values in different units (in this case US gallons) does just that.  Furthermore, as the result suggests, the amount of rain that fell onto Bladen County is enough water to fill 4,000 of the "World's Largest Swimming Pool".  WOW.


Using the "World's Largest Pool" or WLP as a metric really changes the volume of water.  Before the calculation, all that we were left with from the calculations in the first section were enormous amounts of rainfall expressed in units of cubic feet.  With the calculation above, one can easily view the pictures of the WLP and try to make sense of the number.  Furthermore, if that amount of water fell on any geographical region, there would be damage.


As I promised above, I would provide a table with the equivalent information as calculated above for other recent storms.  Think about the following storms which have been covered on this blog site: China, Elliot City (Maryland, USA), Huauchinango (Mexico), Louisiana (USA), and Haiti.


Here is the table with the values as promised above for comparison:


The importance of showing all of the data on the storms is to illustrate the damage caused by different amounts of rain.  Each storm is different.  Which is why the  continual update of weather models needs to be sought after.  Similarly, more money needs to be devoted toward improving storm calculation programs.  Additionally, more technology (sensors, stations, drones, etc.) need to be deployed to pick up data and feed the data back into the models to improve accuracy.


The tragedy caused by the storms this year so far are enormous and incomprehensible.


How do we move forward as a Nation?  


As a World?  


What about Climate Change?  


Are these linked in some manner?


These questions remain open ended along with others.  Although, as long as we move forward as a world thirsty for knowledge and thoughtful/mindful about the magnitude of such disasters, change can proceed in the correct direction.  Too often each of us proceed throughout our day with large amounts of stress and anxiety.  We do this without considering another force, the force of nature.  The force of nature can compound our stress and anxiety by hundreds of orders of magnitude.  Think of those put out of their homes by the storms recently as you stress at work.  Take a minute to think of those without power or water or a house.  Have a great day!


Tuesday, October 4, 2016

How Much Rain Did Haiti Really Receive?

Tonight, as I was writing the blog I just finished on autonomous cars, I was scrolling through Twitter to find the original post and ran across the following tweet shown below:


Immediately, I clicked on the article to find out that Haiti received a significant amount of rain from Hurricane Matthew.  How much in comparison to other torrential rain storms this year?  Read onto find out.


How Much Rain Did Haiti Receive?


According to the news site "NBC News" which posted an article titled "Hurricane Matthew: Relief Groups Mobilize for Haiti After 'Catastrophic' Damage" an enormous amount of rain is expected to hit Haiti.  Here is an excerpt describing the magnitude of the storm:


The storm was expected to dump up to 20 inches of rain on parts of southern Haiti and southwestern Dominican Republic. Isolated areas could get up to 40 inches, the hurricane center said.


Instantly, after reading this, I stopped what I was doing and looked for an old post I wrote a few months ago on the massive torrential rain that China received.  Alright, I published the blog post that I was working on first -- in order to focus on the massive amount of rain that is expected to hit Haiti.


In order to compare the amount of rain that is expected to hit Haiti, I needed to calculate a total volume.  I will walk you through the calculations and logic in the following paragraphs.  Some of the values are approximations which I will try to clarify as we go.  If you have any questions regarding approximations or assumptions, just leave a comment.


With this in mind, first, we need to know how large (area in square miles) Haiti is in order to calculate a total volume.  According to the "Wikipedia" page, the total area of Haiti is 10,714-square miles.   The volume of rain was not reported in the news.  Although, a height was reported. According to the excerpt above, between 20 inches of rain in the Southern part of Haiti and 40 inches in other parts -- which could be approximated (grossly) to an average of 30 inches across all of Haiti.


Over the course of the next few days, news reports will refine their values and we can do a follow up comparison.  Specifically, we can then evaluate how far off our approximation was in this post.  For now, lets proceed with the calculation of the total volume of rain.


In order to calculate a volume, three numbers will need to be known.  Or in this case, two numbers will need to be obtained.  All of them have been specified already in this post.  We will need an "area" and a "height" to determine the total volume.  What's missing then?


The values are all reported in different units.  What?  Yes, we have an area of Haiti that is reported as 10,714-square miles.  Further, we have a height of rain that has or is estimated to fall to be 30 inches.  In order to compare and calculate, the units have to be uniform.  In this case, lets choose units of feet.  Our total volume will be reported in cubic feet of rain.


To convert the reported values, we will need the conversion factors from inches to feet and from square miles to square feet.  From the previous blog on rainfall in China, the value is listed below in the conversion shown below:


Next, the equation for the volume is equal to the area (geographic area) multiplied by the height of the rainfall.  The equation for volume is shown below with the above values filled in appropriately:


Wow!  What does the above result mean?


How Does The Value Compare To Other Recent Storms?


As I mentioned earlier, I wrote a blog post on the torrential rain fall in China a few months ago.  Turns out that 12 provinces received around a couple of feet of rain over a geographical area of 10,000 square miles.  Wow!  The total cubic feet of rain was 580 billion cubic feet.


According to our calculations above, the total rain fall expected to hit Haiti as a result of Hurricane Matthews is 750 billion cubic feet of rain.  That is nearly 1.3 times the amount of rain that hit China earlier this year.  These two storms are huge in comparison to the four other storms that I have wrote blogs about: Maryland (USA), Louisiana (USA), Mexico, and Macedonia.


Still, the fact that Haiti is receiving so much rain over its entire land mass is life threatening.  More so than in China, although the populations and land masses are quite different.  Nonetheless, we should be sending humanitarian aid to the victims of these terrible storms.  By calculating the amount of rain fall each storm drops on a given geographic area, the realization of the threat becomes more real.  Dimensional analysis allows us to visualize the magnitude of such disasters by comparing them to our own geographic area.


How does the geographic area of Haiti relate to the geographic area that you live in?


Think about the magnitude of this devastating event.  How would you be impacted by the same volume of rain?  Remember, the magnitudes and values reported/calculated above, neglect the wind speed of 145 miles per hour that blew across the region.  That speed of wind would produce and life threatening force that would level houses and buildings (if not properly built).


Until next time, have a good night.

What Is The World Going To Be Like With Autonomous (Self Driving) Cars?

Lately, I have been asking myself this question. Especially, as the idea has started to come to reality with Tesla Motors and GM Corporation (purchasing Cruise Automation) looking to have autonomous cars on the road soon.  People are excited about the prospect of not having to pay attention during driving (the reality is different) contrary to the state of autonomous cars.  Already, we have seen unfortunate events of relying too much on the autonomous capabilities of a Tesla Motor vehicle.  Back to the question at hand:


What will the world look like with autonomous vehicles?


Simple answer: No one knows.


Complex answer: read on to find out.


First Guess At A World Of Autonomous Cars!


Recently, I found a story which to me represents the bridge on the path toward a world of autonomous cars.  The tweet shown below from the news site "NBC Los Angeles" is an introduction to what the world will look like with an abundant amount of autonomous vehicles:


The article titled "Car Drives Through Living Room While Family Watches Chargers Game" carryed the unfortunate news of a car crashing into a house while the residents were watching television.  Here is an excerpt from the article explaining the incident and possible cause:


According to Hurn, when the car approached a stop sign across the street the driver hit the accelerator instead of the brake. The crash may have been caused by a medical emergency.
Both the driver and Hurn’s wife, who was sitting on the couch when the car came through the wall, were taken to the hospital.
“She was sitting right on the other side when it happened,” Hurn said of his wife. “Her knees hurt, her ankles hurt and her back hurts.”


What a terrible event to have happen at anyone's house?


Can you imagine sitting comfortably in your house watching a football game and then POW - right through the wall comes a car?


Fortunately, none of the residents were injured severely.  Evidently, this was not the first occurrence at this particular house.  Here is another excerpt describing the last event a year ago:


Amazingly, this isn't the first time someone has crashed into the family's home. 
"It happened about a year ago. Had a guy hit-and-run somebody up the street and he was trying to get away from the scene, drove through our neighbors yard, flew off the wall and hit the corner of our porch."


Taking the facts in based on the reporting in the news, the design of the street was flawed in the neighborhood.  The placement of the stop sign directly in front of the house was not a good idea.  At the same time, this design should be a major consideration in the event that autonomous vehicles become a reality.  Which appears to be the case.


The Reality Of Autonomous Vehicles


We do not yet have autonomous vehicles yet on the roads in the United States today.  The reason why is centered around the complexity in design of the cars and the infrastructure to ensure the dangers are mitigated.  First and foremost, the infrastructure (roads, signaling, signage, laws, etc.) would have to change dramatically.  Simple questions like the following remain unanswered by autonomous car manufacturers:


In the unfortunate even of an accident, whose fault does the accident rely on -- the driver or the autopilot?


How culpable is the automaker for disasters involving the autonomous features installed in vehicles?


How culpable is the government (local, state, and federal) for allowing the automakers to release deadly features on vehicles?


If a problem occurs, what happens then?


Do we wait for a recall?


Some proponents of autonomous vehicles have argued that once an accident has occurred, that will be the only time that type of accident happens.  Why?  Because instant changes can be made to all other similar types of autonomous vehicles that will eliminate that type of accident from occurring in the future.


Does the car learn from each accident?


As of right now, the current state of autonomous vehicles is appropriately summarized in an article discussing the unfortunate accident of Tesla in Florida months ago:


The accident occurred on a divided highway in central Florida when a tractor trailer drove across the highway perpendicular to the Model S. Neither the driver — who Tesla notes is ultimately responsible for the vehicle’s actions, even with Autopilot on — nor the car noticed the big rig or the trailer "against a brightly lit sky" and brakes were not applied. In a tweet, Tesla CEO Elon Musk said that the vehicle's radar didn't help in this case because it "tunes out what looks like an overhead road sign to avoid false braking events."

Because of the high ride-height of the trailer, as well as its positioning across the road, the Model S passed under the trailer and the first impact was between the windshield and the trailer. Tesla writes that if the car had impacted the front or rear of the trailer, even at high speed, the car’s safety systems "would likely have prevented serious injury as it has in numerous other similar incidents."


Based on the logic provided by Tesla in the excerpt above, would you place your life in the hands of Elon Musk?


Elon musk has genuine intentions to reach Mars and provide the world with cheaper energy along with amazing cars.  Although, the pace at which he is going on both fronts is rather scary.  Additionally, the Tesla car corporation has not been totally upfront and on top of reporting unfortunate incidents in which their cars are involved.  Did you hear about the death of a resident in China who was in a Tesla vehicle with the autopilot engaged?  Why not?


I would be more likely to believe car data coming out of GM corporation who has recently been slogged through years of skepticism regarding the safety of their vehicles.  They have more to lose and should be on top of their game in terms of regulations and safety procedures.


Although, the "bottom line" is what counts as success in business unfortunately -- not peoples lives.  In the excerpt above, the car company Tesla amounts of the death of the driver to 'not paying attention' and says that had the car not made the mistake of recognizing the trailer as an overhead traffic sign, the car would definitely have performed well.  Really?


This begs the need for infrastructure to change too.  At the same time, the government should hammer Elon Musk for his disrespectful behavior in regards to the death of a soldier in one of his cars.  Laying the blame by claiming his vehicles have traveled millions of miles on autopilot is arrogant and untrustworthy.


Lets hope that Elon Musk returns to planet Earth with a sensible and logical approach with safety in mind.  He needs to meet the rest of his potential customers with a safe reliable car that will return them back to their family at the end of the day.


In regard to autonomous vehicles occupying our streets in the future.  We are far off from a truly autonomous vehicle showing up in front of our houses.  The future of technology is exciting.  At the same time, the future of the rise of technology is scary too.  Lets be as measured and engaged as concerned citizens as possible.  Until next time, have a great evening!