The facility is used to store gas -- natural gas for the residents of the Southern California by the SoCalGas -- a Sempra Energy company. The Los Angeles Times has a page that contains updates on the Porter Gas Ranch leak. As I mentioned above, the actress/activist Erin Brockovich recently visited Porter Ranch residents. According to an article in the LA Times she spent just 10 minutes inside a residents home and experienced issues affecting her breathing. Here is an excerpt of the event and the follow up visit with a physician:
vie-famous activist Erin Brockovich stood in front of 400 Porter Ranch residents on a recent weeknight and told a disturbing personal story."When I first came to Porter Ranch I couldn't believe it," she said of her visit to the community closest to Southern California Gas Co.'s leaking well. "I was in somebody's house and within 10 minutes, I started feeling kind of dizzy."She said she saw a doctor who told her she "had what they called a chemically induced kind of bronchitis."
The message was clear. If Brockovich, 55, became ill after just 10 minutes, Southern California Gas Co.'s ruptured well must be harming anyone who breathes the fumes even for a short time — and for that, the victims should get compensation. Brockovich and the law firm she was advocating for, Weitz & Luxenberg, invited the residents to join their lawsuits against the gas company.
After reading this along with other updates, you might be asking yourself the following questions:
1) How large is the underground storage facility? i.e., how much gas is in the ground?
2) How concentrated is the gas flowing past the residents of Porter Ranch per hour?
3) How long have the residents been exposed to dangerous levels of chemicals contained in the gas?
Each of these questions is very important to the community. Further, each of these questions is important to the world at large. Why? Well, the amount of gas released thus far could potentially add to the annual output of green house gas emissions.
Really? That much gas has been released?
Again, to get a better understanding of the issue, lets look at a few statistics using dimensional analysis from reports in the popular news recently.
How Much Gas Is Stored Underground?
To answer this with an exact number is complicated (as has been reported). The reason is that until the storage facility is completely empty, the company cannot tell exactly how much was stored underground.
First, here is a video that was taken from an article on the website 'Ecowatch' written by Erin Brockovich that shows the extent of the complexity associated with the gas leak:
Wow! Can you imagine trying to contain that flow of gas? A reader (any reader for that matter) cannot help but wonder what the total volume of gas held under ground was before the disaster happened. The reservoir must be huge. Understanding the size of the reservoir might help the reader understand the magnitude of the problem. Furthermore, how difficult the problem is to deal with. Cast in a different light:
How large is the storage tank at the Aliso Canyon storage facility?
With the disasterous affects on the community, the coverage is HUGE surrounding the ongoing problem. Therefore, to find out the answer is not difficult. In fact, there is a 'Wikipedia' page devoted to the Aliso Canyon Gas Leak. On that page is an excerpt with the speculated total volume of the underground storage tank that serves around 115 wellls (one of which is leaking):
The Aliso Canyon natural gas storage facility contains 115 wells tapping a reservoir that "hold[s] up to 86 billion cubic feet of natural gas for distribution to residences, businesses, and electric utilities in the L.A. basin".[6] The field is the second largest storage facility of its kind in the United States.[2]
That figure is close to being incomprehensible. In science, numbers are expressed in 'scientific notation' for brevity since typically the numbers are enormous too. The reason why that is the case is due to the inherent size of the 'atom' and 'molecules' that make up matter that is visible to the naked eye. In this case, the number is large due to the size of the natural gas reservior in which is gas is stored. According to the Southern California Gas -- which owns the facility, there are 115 wells distributed across several thousand square acres. The original intent of the project is stated below:
Southern California Gas Company (SoCalGas®) delivers safe, reliable natural gas to 20.9 million consumers throughout Central and Southern California. To help keep prices low, protect customers from price spikes, and meet higher customer demand for natural gas in the winter, we buy gas throughout the year and store it at our storage facilities like Aliso Canyon. Natural gas from the storage field also helps supply the energy needed for electric generation.SoCalGas operates and maintains the Aliso Canyon natural gas storage facility, the largest of four such facilities. At the Aliso Canyon storage facility, we store natural gas thousands of feet below the earth’s surface in depleted underground oil fields. Above the stored natural gas are impermeable layers of rock and geological formations. Currently, three natural gas turbine-driven compressors are used to inject the gas deep into the ground. This equipment, installed in the 1970s, must be replaced after years of careful maintenance. To inject the natural gas as needed, we are installing new, efficient electric compressors. In order to operate the electric compressors, Southern California Edison Co. (SCE) will install new and modified electrical sub-transmission facilities.The Aliso Canyon storage facility, located north of Porter Ranch and Northridge, sits on approximately 3,600 acres of land. The project area is about three-quarters of a mile beyond the Sesnon Boulevard entrance and will be located within a valley on the property. This project is anticipated to result in a significant reduction of air pollutants and greenhouse gases at this site.
Since the leak, most of the information is useless now that there has been great harm done by the leak over the last few months. The company should have shut down the well immediately (no matter how difficult the project was). Of course, as a person from a distance, the act of shutting the well down seems easy (that is if you have no direct experience with such work). According to a diagram from an article posted on the website Utility Dive the fix involves a massive amount of work that is located very far underneath ground as indicated below:

Source: Utility Dive and SoCalGas
The top of the natural reservior is 8000 feet below the surface -- oh my goodness. That is deep. Now that I have made clear -- highlighted the depth (8000 feet underground) and the volume of the reservior (86 billion cubic feet), I thought that we might use dimensional analysis to help cast these two extraordinary numbers into light. Lets start by asking about the depth of the well by asking the following question:
How does the depth of the gas well compare to the height of the Empire State Building in New York City?
In order to carry out the analysis, we will need the determine the height of the Empire State Building. According to the Wikipedia page for the Empire State Building (ESB), the height of the buidling is 1,454 feet tall. I used an abbreviation of the Empire State Building to be 'ESB' which is helpful in following the calculations below. Before I show the calculations, a picture of the building would be useful -- which is shown below taken from the Wikipedia page:

Source: Wikipedia -- Empire State Building
Remember, the first calculation is to determine how much of the building (shown in the picture above) will be reached in comparison to the depth of the gas well in the Porter Ranch controversy. Below are the results of my calculation:
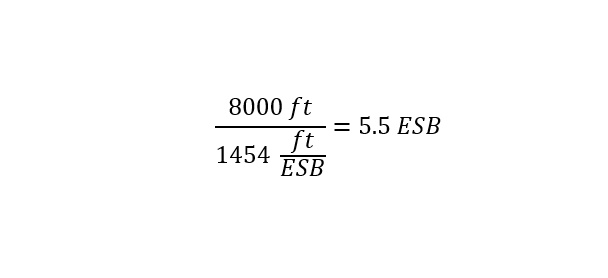
To interpret the results from the analysis above, the following can be said of the comparison. If 5 and 1/2 Empire State Buildings could be stacked on top of each other, the height would be equivalent to the depth to the top of the gas reservoir 8000 feet below ground. Below is a pictorial diagram using both images from the originals above:
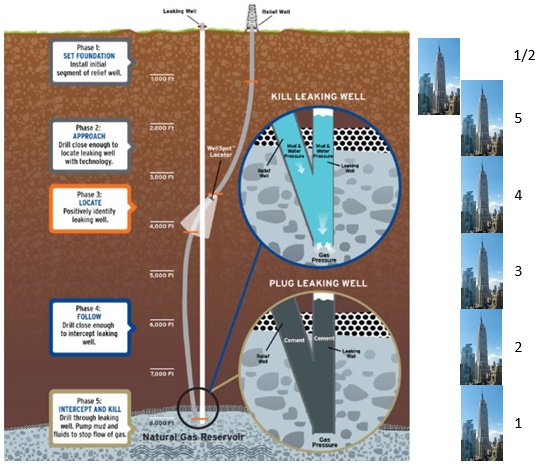
On the right side of the image, there are 5 1/2 images of the Empire State Building above -- stacked to equal the depth to the gas reservoir.
Additionally, since the Empire State Building is being used as a 'metric' for comparison using dimensional analysis - the analysis could be extended to compare the volume of the Aliso Canyon Gas reservoir. We could ask the following question regarding the volume:
How does the volume of the gas reservoir compare to the volume within the Empire State Building?
To start the analysis, we need to convert the volume of the Empire State Building to scientific notation -- which is shown below:
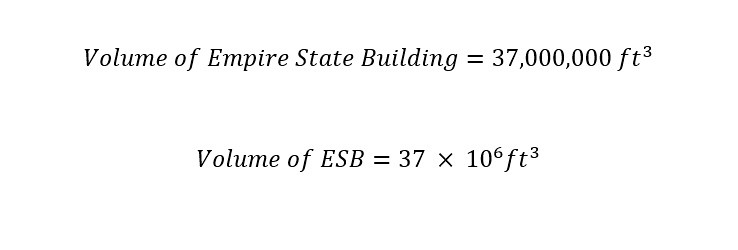
Next, the analysis involves a single-step division of the two volumes (gas well = 87 billion cubic feet and ESB = 37 million cubic feet). The calculation is shown below comparing the two values:

The result reveals that the volume contained in the gas reservoir at the Aliso Canyon Gas Storage facility which is 8000 feet below the ground would fill a total of 2,351 ESB or Empire State Buildings. WOW. That is truly astounding. Now the issue at hand with regard to the neighboring residents health at Porter Ranch is starting to come into perspective.
Although, one could argue that to actually visualize the amount of ESB's would be extremely difficult. Therefore, is there a better volume to compare the gas reservoir to? Indeed, how about the Mercedez-Benz Super Dome. I have used the space (volume) before in a blog post on this site. Remember, the post regarding the volume of mine water in Brazil? Here is the post to refresh your memory.
To carry out the analysis of comparing volumes, the volume of the Mercedez-Benz Super Dome needs to be known. According to the Wikipedia page for the Super Dome, the interior volume is 125 million cubic feet.

Source:"The Dome New Orleans Man Trip" by David Reber
The comparison is shown below in a single step:
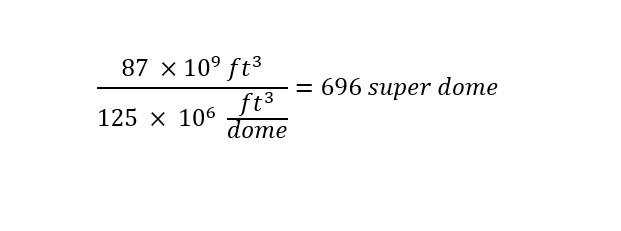
Based on the photo of the Super Dome, I would have guessed that the number was fewer than that. Alternatively, the volume of gas contained in the gas reservoir is enormous and very incomprehensible -- a difficult number to cast into light through dimensional analysis.
How about the rate per hour of the leak. The video above shows an enormous amount of methane being spewed out into the environment. Since the start of the disasterous leak, the pressure to monitor (closely and accurately) has been quite large (as you can imagine). A table has been tabulated and presented (and updated periodically) by the California Environmental Protection Agency -- Air Resources Board is shown below:
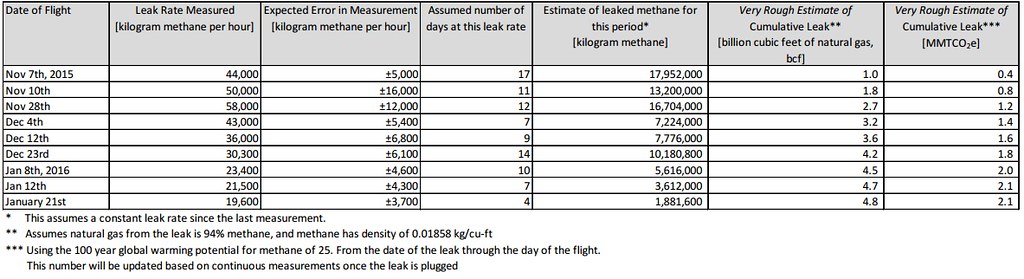
The data of interest to us for the purpose and calculations in the blog post are located in the first and fifth columns. Data in the first column is reported in kilograms/hour of methane. In the fifth column, the data (cumulative) amount of methane that has been leaked is reported. Cumulative means that the values should increase going from the top to the bottom of the column (tracking the history of the leak). Using the data in first column -- we can answer the following question to get a better grasp of the amount of methane that is leaking on an hourly basis:
How many 'Goodyear' blimps could be filled per hour with the flow rate reported as of January 21st?
To answer the question using dimensional analysis, two values need to be determined. The first value is the flow rate -- which is given in the first column of the table above (19,600 kilogram/hour). Finding the volume of a typical blimp can be difficult. I found a range of values on the website How Stuff Works -- which cites between 67,000-250,000 cubic feet. Remember, the type of blimp that we are using is shown below:

Source: ABC News
To start the calculation, the reference values need to be expressed in similar units. The flow rate is expressed in units of 'kilogram/hour' which is not directly comparable to cubic feet (volume of a gas contained in a blimp). Therefore, to start with, the flow rate needs to be converted from units of 'mass/hour' to 'volume/hour'.
In order to perform the conversion, the density of the chemical needs to be known. The density is the relation between mass and volume of a given chemical and is expressed in units of 'grams/mL' here in the U.S. The density of methane is given in the table above -- down in the footnotes of the table to be -- 0.01858 gram/cubit feet. With this value in hand, the conversion and calculation can be accomplished easily below as shown:

The calculation reveals that on an hourly basis, the amount of methane that is leaking out of the Aliso Canyon Gas Storage facility is equivalent to filling up 4 blimps. WOW. That is a tremendous amount of gas leaking out of the well. No wonder the community is up in arms about the amount of gas spewing out of the well. I will be interested to see the outcome of the litigation of this terrible event that has plagued the community for the last several months.
The situation has emerged to be so bad that local businesses are taking action -- including ours -- a university. Yesterday, the Provost of Academic Affairs sent out this letter to all of the faculty regarding the fall out from the major gas leak:
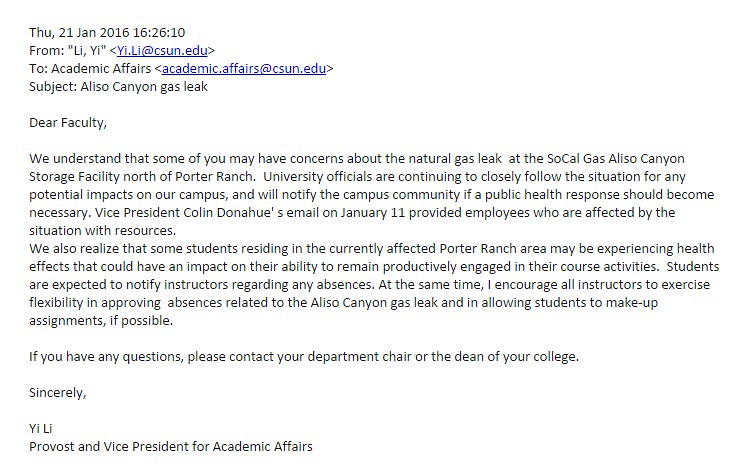
This appears to be an open invitation for students to take advantage of the system by excusing themselves from an assignment or exam. Hopefully, the excused absences are legitimate in nature. The total consequences or environmental fall-out from this leak is unknown. I am not the only person performing comparison calculation using dimensional analysis.
More Statistics Using Dimensional Analysis In The News
Two different articles that I ran across had a few interesting statistics to cast the leak into light. Let me state at the outset that I am not going to confirm or recreate these statistics in this post. I will look more into the sources and include them in a follow up post (in a week or so -- stay tuned -- for part II).
The first article with rich statistics was out of the Los Angeles Times titled "How Much Damage Is The Porter Ranch Leak Doing To The Climate". Here is an infographic from the article:
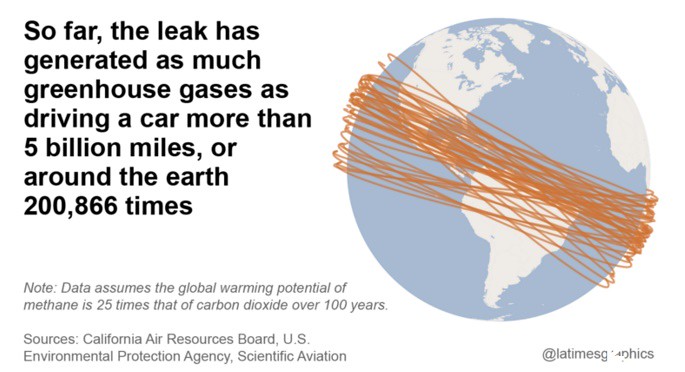
As a person (aside from being a chemist) who loves statistics, I loved looking at the infographic above. Further, I will try to repeat the calculations in 'Part II' of the blog post.
Another article of interest filled with a few very cool statistics was from the website C&ENews titled "Estimating The Environmental Impact Of Southern California's Great Methane Leak". What is great about this article's statistics is that the sources of the data are given (in the form of links to a data page). This is one noticeable difference compared to a general 'news' site. The statistics are being generated in real-time (since October 23,2015). Therefore, the images that are shown below are snapshots taken from today -- Friday afternoon. Here are the three different statistics that are offered in this article:
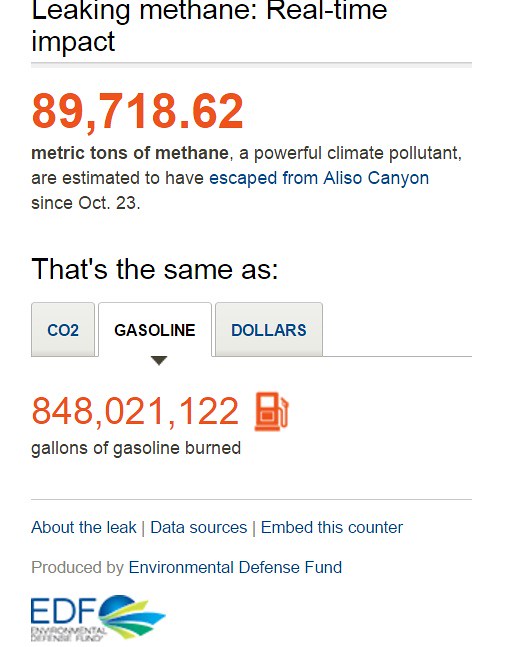
Equivalent amount of gasoline!
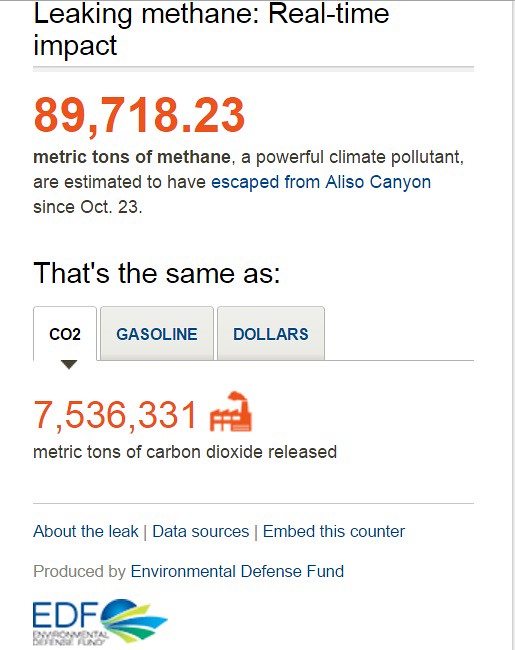
Equivalent amount of Carbon Dioxide
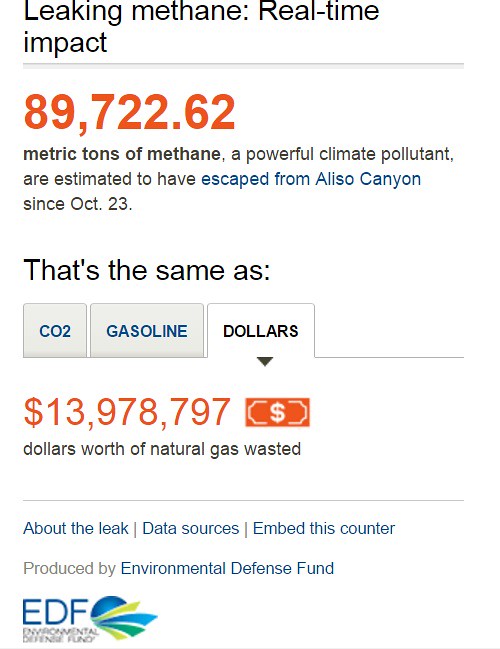
Whoever came up with this idea at the Environmental Defense Fund should be given a raise. Having real time statistics brings the reader that much closer to the issue at hand -- which is that there is a huge amount of methane leaking out of the well. Spend some time thinking about the damage (in terms of quantities and dollar amounts) that have occurred as a result of the leak. Ask yourself the following question:
How would I deal with the existing problem of a leaking gas well? (based on the numbers presented above)
Furthermore, the amount that is leaking out and causing havoc to the atmosphere around the globe is only getting worse by the second -- as indicated with the above counter (measuring device). Having access to knowledge about the problem really clarifies the extent of the issue. Of course, the knowledge is one aspect of the issue at hand. The action (whether Federal or State) taken will be another large component to the issue at hand. There is no argument that action needs to occur quickly. A couple more important questions to entertain among many is the following:
What do I expect regulatory agencies to be doing during this massive leak?
How about politicians that I have elected to office?
In the next blog post -- Part II -- of this story, I will try to duplicate the calculations behind the statistics that came from the two articles -- LA Times and C&ENews. One final thought regarding the leak that I will leave you with is the following. Remember that the leak is continuously seeping (or flowing) from the well. One major complicating factor in getting data (especially if one inspects the flow rate in the table above) is that the amount of pressure in the well is not constant. Over the course of draining the gas reservoir, the pressure has changed which will have an impact. What type of impact? I will leave the answer up to the reader (you) until the next post. Until then, have a wonderful weekend.
No comments:
Post a Comment