Showing posts with label Data Sets. Show all posts

Thursday, February 28, 2019

Hurricane Maria Destroys Puerto Rico's Science Programs Then Presents Unusual Research Opportunities?


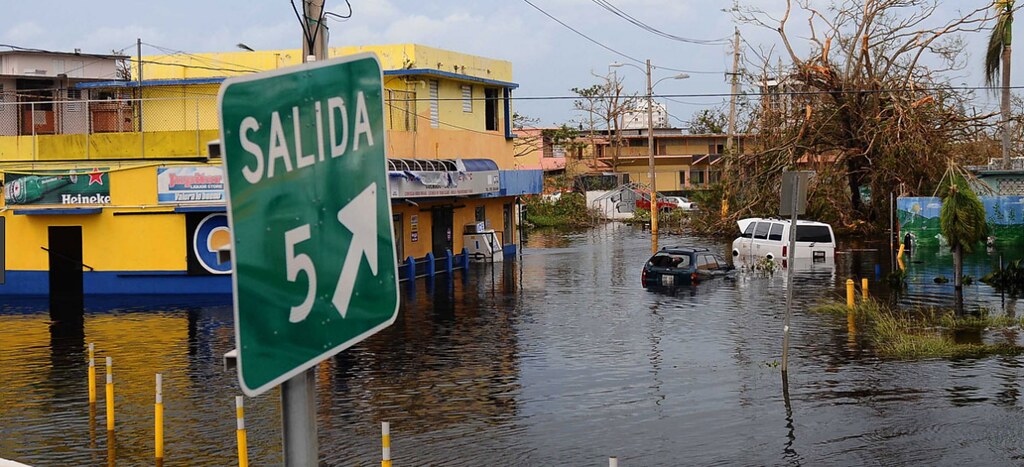
The devastation caused by Hurricane Maria is still being revealed nearly a year and a half after the storm ripped through the island.  Of course, anyone who has lived through a disaster like this will tell you that the island will probably never recover.  Not to mention that the loss of life can never be replaced.  With that being said, any community (or island) must find the courage to recover and re-establish life as it were if possible.  


Under normal conditions, agencies such as FEMA (Federal Emergency Management Agency) would provide sufficient funds to help the island start the journey toward recovery.  Unfortunately, we do not live in normal conditions at the current moment under the current administration.  Funding agencies are being stressed beyond reach for existing funds and when this occurs, areas like scientific research usually suffer the most. 


How Did Maria Impact Science?


At the very least, the lightest impact (which actually may not be true due to PTSD), the lab members may undergo treatment to make sure that there are no residual medical issues after a storm has hit the island.  Of course, if you have no laboratory staff: graduate students, undergraduate students, postdoc's, professional researchers -- then you have no lab.  Meaning, all the best equipment can occupy the lab, but without scientists to run and monitor the instruments, then there is no lab.


The second critical component of any scientific laboratory are the scientific instruments and infrastructure in which these along with the supplies (beakers, tubing, cell cultures, glove boxes, etc.) needed to conduct good/sound science.  This is sometimes the perceived most critical component of any scientific laboratory.  Although, I would argue that the scientists which occupy any laboratory are the most critical components to any scientific instruments.  I have yet to see any scientific instrument just start collecting data by itself without any scientist's intervention/initiation.


A recent article in 'The Scientist' titled "Science in Puerto Rico Still Recovering After Hurricane Maria" details some of the disastrous consequences to a scientific laboratory after a storm of a magnitude such as Hurricane Maria.  The human damage alone can be irreplaceable not to mention the buildings and local municipal utility grid.  And when the destruction to the infrastructure is considered, parameters such as mold and water damage can set a laboratory recovery back several months to years:


Giray’s lab is among 14 or so in the Julio Garcia Diaz biology building, which was among those severely damaged, particularly as it was already undergoing roof repairs when the storm hit. Water seeped in through the roof and windows, damaging costly research equipment, furniture, and lab materials. Toxic mold thrived in the moist, hot climate, creating hazardous conditions that made the building uninhabitable. Power outages cut off researchers’ freezers and fridges, destroying precious genetic and tissue samples for good. The damages are estimated to range from $250,000 up to $2.5 million dollars per lab in that building, says Giray, a behavioral biologist whose main focus is honeybees.


Even more important are samples which are collected outside of the laboratory or purchased for several thousand dollars which are sensitive to temperature/humidity/vibrational fluctuations:


Some of the casualties from the hurricane are less easy to restore: “Collections take much longer time and may never be replaced,” says Giray’s colleague Riccardo Papa, who lost almost all of his DNA samples documenting the diversity of butterflies across South America when his lab’s –80 °C freezer lost electricity. Papa, an evolutionary biologist, didn’t have a lab again until a week ago, and until recently has been meeting with his students and postdocs at coffee shops or places around campus to discuss research. He has been able to do some experiments and genetic analyses in another building. Repairs are still underway for the damaged insectary, in which his team raises butterflies.


Research must go on.  With or without the infrastructure.  Here in California, after the Northridge Earthquake in 1994, FEMA set up temporary 'mobile homes' to serve as both classrooms and temporary offices along with laboratories in certain circumstances.  To hear that 'group meetings' were still being held at coffee shops is a testament to the pace of recovery.  In a majority of cases after a disaster, classroom recovery comes first, then eventually research laboratories.  Although, it is worth remembering that each research laboratory group is made up of students and research professors who take years (applying for individual grants/writing publications) to acquire the appropriate funding to purchase research scientific instrumentation.  Therefore, to put a price on the total loss in the event of a disaster like Hurricane Maria proves extremely difficult.


The total cost to a researcher is really unknowable for years to come.  Some researchers never recover and decide to shut down their laboratories after such a storm.  Which leaves current graduate students without an end in sight to their degrees (M.A. and PhD).  Additionally, staff (professional researchers) might quickly find themselves out of work and have to leave regions like Puerto Rico and find work elsewhere.  Which means transplanting their families and children's education to a different geographical location.  The cost can be severe not just to the researcher themselves.


More can be written in future articles on this theme of disasters and research laboratories.  Either together or separately.  The total cost to a geographical location from a disaster such as Hurricane Maria can only be estimated at the beginning (a very rough approximation).  The price tag evolves over time with the disbursement of emergency funds by organizations such as FEMA along with other federal organizations or the Congress.  The terrible destruction to a scientific institution is terrible to say the least.  Restoring science should be a high priority among others on the island of Puerto Rico.


Tuesday, July 17, 2018

Parameters: Amazon Go Will Seek To Understand How You Feel About A Grocery Product?

Source: China Brands


Technology has served many different functions in our society.  Among the most important recently are the algorithms which correct themselves while directing people around the world.  Yes, I am talking about the residents of the world who use 'GoogleMaps'.  Over time, the algorithm seeks to improve the accuracy by self assessment.  What? Yes, the algorithm updates and assesses itself after every use.  Amazing.  Back in January in Seattle, Amazon opened up a store without cashier type check out stands.  Yes, without check out stands.  I have been sitting on this short post for quite a while for no good reason.  Although, with the greater use of digital tracking of our preferences, the subject is worth highlighting.


Do I Really Love That Food?


Back in January, an article in 'The New York Times' titled "Inside Amazon Go, a Store of the Future"


But the technology that is also inside, mostly tucked away out of sight, enables a shopping experience like no other. There are no cashiers or registers anywhere. Shoppers leave the store through those same gates, without pausing to pull out a credit card. Their Amazon account automatically gets charged for what they take out the door.
There are no shopping carts or baskets inside Amazon Go. Since the checkout process is automated, what would be the point of them anyway? Instead, customers put items directly into the shopping bag they’ll walk out with.
Every time customers grab an item off a shelf, Amazon says the product is automatically put into the shopping cart of their online account. If customers put the item back on the shelf, Amazon removes it from their virtual basket.  
The only sign of the technology that makes this possible floats above the store shelves — arrays of small cameras, hundreds of them throughout the store. Amazon won’t say much about how the system works, other than to say it involves sophisticated computer vision and machine learning software. Translation: Amazon’s technology can see and identify every item in the store, without attaching a special chip to every can of soup and bag of trail mix.  


Before the above excerpt can be explored more, the differences between a traditional grocery store and the new store offered by Amazon should be briefly highlighted.  Grocery stores with the option of 'cashier assisted' checkout are nothing new.  Stores ranging from Ralphs to Home Depot (or Lowes) have all incorporated the 'checker' less option.  What is new is the option without a 'check out stand' altogether.  To test your ability of paying attention to the potential impact of opening a store such as that which has been open for over a few months now, there are a few questions which a school teacher came up with in "teacher has come up with questions" from 'The New York Times' shown below:


1. What type of convenience store opened in Seattle on Jan. 22?
2. What details make the Amazon Go store different from a traditional grocery store?
3. What is noticeable about the photos in the article? What do they show about the new store?
4. How are items paid for in the Amazon Go store, and what is eliminated in the process?
5. What does Amazon say about the role of cashiers and potential loss of jobs with the new system? 
6. Why does the author say the experience feels like shoplifting, and what happened when he attempted to shoplift a four-pack of vanilla soda?


The above questions represent a good exercise in critical thinking for the article under scrutiny about the new grocery stores.   You may be wondering why I am bringing this up now when the stores have been open for the last few months.  The reason is that there is a larger change at hand with this new technology.  Amazon is looking to expand the information extracted about each customer by introducing new technology.  The grocery store is just one.


Inside the grocery store are a large amount of cameras which are tracking movements.  Not to scare you in any way, this is for the main purpose of tracking purchases.  Although, the amount of time that each customer stands in front of a given product is being recorded along with the customers who simply walk by and pay no attention toward a given item.  This technology is being extended into algorithms which are embedded into the 'Kindle' by Amazon.


I accidentally misplaced the reference (the name of the podcast/episode) which described the shift in Amazon's strategy to gather more information out of their readers Kindle usage.  Including tracking how long each reader stays on a page and if the reader returns to a section with a given phrase or story.  This information will inevitably help Amazon sell better books by adjusting the plot to tailor the customers exact needs.  Scary?  Possibly.


Conclusion...


The changes proposed or being sought by Amazon are interesting and potentially frightening.  As the Virtual Reality pioneer -- computer scientist -- Jaron Lanier implied in his book titled "Who Owns The Future?" -- nothing is for free in Silicon Valley.  Meaning, any discount or free technology is accompanied by a lengthy 'legal disclaimer' which is basically saying that the information collected on this device belongs to Amazon or any other technology company.


At the same time, Jaron Lanier states that in order to get around such an inevitable problem, a new system will have to arise -- something akin to 'micro-payments'.  If the user is unwilling to pay the 'micro-payment' then a short commercial might need to be watched by the user to access the 'free service'.  Ultimately, the technology offered by Amazon might not be terrible given that the time needed to search for an interesting book for a person will be reduced as A.I. algorithms become more intelligent.


In the end, the technology depends on a choice by the consumer (you and I).  Are we willing to give up our information for a "free service"?  Do we really understand what data is being collected by theses technology companies?  Do we really care what data is being collected?  These questions will have to be answered in the future as technology rapidly advances in data collection over time.


Related Blog Posts:


Science Topics, Thoughts, and Parameters Regarding Science, Politics, And The Environment!


Friday, April 13, 2018

What Is Dimensional Analysis?


What is dimensional analysis?  Have you ever used dimensional analysis in your everyday life?  Here is the introductory description which is located on the Wikipedia page for "Dimensional Analysis":


In engineering and science, dimensional analysis is the analysis of the relationships between different physical quantities by identifying their base quantities (such as length, mass, time, and electric charge) and units of measure (such as miles vs. kilometers, or pounds vs. kilograms vs. grams) and tracking these dimensions as calculations or comparisons are performed. Converting from one dimensional unit to another is often somewhat complex. Dimensional analysis, or more specifically the factor-label method, also known as the unit-factor method, is a widely used technique for such conversions using the rules of algebra.[1][2][3]
The concept of physical dimension was introduced by Joseph Fourier in 1822.[4] Physical quantities that are of the same kind (also called commensurable) have the same dimension (length, time, mass) and can be directly compared to each other, even if they are originally expressed in differing units of measure (such as inches and meters, or pounds and newtons). If physical quantities have different dimensions (such as length vs. mass), they cannot be expressed in terms of similar units and cannot be compared in quantity (also called incommensurable). For example, asking whether a kilogram is greater than, equal to, or less than an hour is meaningless.
Any physically meaningful equation (and likewise any inequality and inequation) will have the same dimensions on its left and right sides, a property known as dimensional homogeneity. Checking for dimensional homogeneity is a common application of dimensional analysis, serving as a plausibility check on derived equations and computations. It also serves as a guide and constraint in deriving equations that may describe a physical system in the absence of a more rigorous derivation.


Wow!  Does that sound complicated?  Basically, what the description says above is that if you are comparing the mass of two oranges, both the units of measurement (weight) in this case have to be in the same 'units' - grams, pounds, kilograms, etc.  If you weight orange number #1 and report a weight of 70 grams, then try to compare a second orange's weight reported as 0.400 kg (kilograms) - then the comparison cannot be completed.


At least until you convert the weight of orange #1 to units of kilograms or weight #2 to units of grams.  If both weights were expressed in the same units -- say grams, then orange #1 weighing = 70 grams -- would be much smaller than orange #1 weighing = 400 grams.  The same logic applies to base quantities (dimensions) -- like length, mass, volume, height, speed, etc.


How about trying another route to clarify the description in the excerpt above.  If you have ever tried to follow a recipe while cooking, then chances are you have engaged in 'dimensional analysis' without knowing that you were doing so.  Don't believe me? Follow the quick cooking example below.


Example: Cooking


Here is a quick example of using 'dimensional analysis' in your kitchen.  Take the recipe shown below as an example:


The recipe above calls for 100 mL of milk.  That is 100 milliliters of milk.   What if the kitchen in which you are preparing the shake does not contain a 'measuring cup' shown below which is extremely useful in converting between different units of measurement:


Source: HomeDepot


Upon closer inspection of the image of a 'measuring cup' above, one can easily see a series of markings at different heights with different labels.  These labels indicate different volumes of measurement in different units.  According to the image of the recipe shown earlier, the amount of milk called for in creating the shake was 100 mL -- Which could easily be converted using the instrument above -- i.e. measuring cup.


Although, what would you do if you did not have a measuring cup within the kitchen in which preparation of the shake was taking place?  How would a person find the conversion factor to convert between units of 'milliliters' and units of 'cups'?  One easy method with the advent of the internet has been to resort to to a 'search engine' like 'Google' or 'Bing'.


Proceed to bring up a web browser and bring up Google.com and type in the search space: "How Many Milliliters In A Cup?" and the web page with the conversion (interactive) columns should appear as shown below:


Note: The conversion shown above is 'interactive' - which means that the labels are 'drop down' menus which can serve to change either 'units of measurement' or 'dimensions' (i.e. length, area, volume, time, speed, etc.).  Feel free to play with the web page to convert between units of various dimensions.


Next, with the conversion factor known which will assist us in converting between units of 'cups' and units of 'milliliters', the remaining step in the conversion is to carryout a mathematical operation as shown below:


The result indicates that in order to follow the recipe (approximately -- not precisely), roughly 1/2 cup of milk will correspond to 100 milliliters of milk.  Note that the conversion is approximate -- since 1/2 = 0.5 not 1/2 = 0.423 !!!


Is the method of carrying out a dimensional analysis problem is clear?  If the answer is yes, then you are ready to read past blog posts which mainly use 'dimensional analysis' to cast statistics reported in the news into perspective -- click here to access the index of past blog posts.  If you are not comfortable with carrying out 'dimensional analysis' problems, see the tutorial below.


Dimensional Analysis Tutorial


A Tutorial on Dimensional Analysis is shown below:


After watching the video above along with reading the content of the blog post so far, you may be wondering where to get conversion values if not from the internet.  Science textbooks have conversion tables.  After a quick search of conversion tables, the 'Accidental Scientist' appeared with a host of information.  Here is a screenshot of an example of a table of conversions below.  Note: if you click on the source, you will be directed to the site:


As you can see, there is no need to memorize conversions -- at least all of the conversions.  That is what reference materials are for when needed.


Conclusion...


In the paragraphs above, the useful (and fun) method of carrying out calculations using 'dimensional analysis' was shown.  Armed with the power to carry out comparisons with conversion factors allows you to verify a large portion of statistics which are reported in the popular news on a day-to-day basis.  Is this useful?  Depends on how much energy that you choose to exert in understanding the process of using it to live a better life.


Understanding the power of comparison with conversion factors will add extra dimensions of happiness to your life.  How do I know?  When a person can visualize or comprehend the magnitude of a reported statistic by putting the value into perspective using dimensional analysis, the problem or subject matter of the news article becomes that much more useful to the reader.  Again, thank you for visiting the website and check out the dimensional analysis blog posts by clicking here.


Related Blog Index:


Dimensional Analysis Of Statistics And Large Numbers - Index Of Blog Posts


Tuesday, November 22, 2016

The NFL Is Collecting Big Data?

Currently, there is a data revolution occurring in the world.  Recent articles in professional journals often highlight the need for science based data degrees.  The hope is to have data scientists migrate often away from the field of science into more lucrative jobs crunching numbers to determine how to increase the number of "likes" and the sort.  Add to that craziness, and you get big organizations like the National Football league joining the party of 'big data' collection.  The question is the following:


What is the NFL going to do with the 'big data' collected?


In order to find out a few of the possibilities, one must continue to read below.  The possibilities are endless, although, the initial reasons are restrictive.


What Is Big Data In Football?


When I read the title of the article on the website "Scientific Computing" titled "The NFL Joins The Data Revolution in Sports", the first question that came to mind is:


What data are they collecting that is not already being collected?


I was confused by the title of the article, since, one would think that a huge organization like the NFL would already have an enormous amount of data.  Think about the gambling industry across the world and their profits on sports.  One would imagine that big data has played a significant role already in generating an enormous amount of profits from big data.  Evidently not.  Hard to believe.


According to the article mentioned, the NFL is just entering the field of "Big Data":


In some potentially game-changing news for the way we understand professional football, the National Football League began the 2016 preseason by placing tracking sensors in its footballs for the first time. The chips are also in balls used in Thursday night games.

Over the past decade, we’ve seen an explosion in data analytics in sports, particularly on the professional level. Technological advances in cameras and sensors have allowed teams, media and fans to gain insight into a bunch of previously gray areas of sport performance, such as the National Basketball Association’s use of SportVU to track every bit of player and ball movement on the floor.

The concept of integrating numbers and analysis into scouting, training and coaching isn’t new. But access to powerful hardware and software has greatly increased the quality and quantity of available data. A nearly insatiable appetite for data on sports has created a sports analytics market that is set to grow from the millions to the multiple billions of dollars over the next few years.


 The amount of data generated during each game would be enormous.  By keeping the sensor limited to the football and possibly the sidelines, the data generated would be reduced too.  Although, with a reduction of data flowing in from the game, the accuracy of the plays suffer too.  The author mentions that the next step would be to incorporate sensors into the players 'shoulder pads' - which would increase the data stream coming in.


Overall, the practice would be transformative to the entire industry.  I wonder how that would change the challenges that referees face during the game.  Currently, during a challenge, the play is reviewed on a closed circuit screen available to the referee and officials only.  With the rise of sensors, now the game can be analyzed by each team in real time.  Although, the technology is not distributed in real time yet.


Any avenue of improvement that the coaching staff can incorporate into the teams training regimen would be greatly sought after.  Currently, teams are exploring both game simulators and drone coverage of their practices to improve overall flow.  The incorporation of data from the NFL offers two great aspects of improvement:


Ideally, data from ball trackers or shoulder pad trackers could serve two purposes for the NFL. First, it can help teams understand player movement and the flow of play more completely, providing coaches a greater understanding on how players are physically performing during plays, and allowing for input from coaches to players on how to fix their technique to increase efficiency or limit exposure to injury, possibly leading to more efficient training and practice.

Second, the data can be used by the league’s media partners, and perhaps its fans, to further explain the game to audiences, particularly on television. By tracking player movement digitally, clearer representations of what makes individual football plays succeed (or fail) can be provided. These data also allow media to break down individual physical accomplishments, such as extraordinary bursts of speed by wide receivers.

The NFL’s plan to release tracking data within 24 hours of a game’s end points to a future in the league where hard data on player and ball movement are integrated into the daily strategic calculations of each coaching staff. This will likely create a rush to innovation within NFL coaching, as each staff grapples with what will likely be a huge amount of data every week, trying to come up with best practices and analytical methods for evaluating and using that data constructively.


Of course, generating a tremendous amount of data means that the NFL along with individual teams that participate need to have the technological infrastructure (computing power, data scientists, etc.) to make meaningful use of the data coming into the organization.  This requires both technology and scientists to handle that technology in a fruitful manner.


That means scientists will be taken away from professional fields in which they were trained to contribute.  Is this good?


NFL Data Science Improves Science Indirectly


There are a tremendous amount of scientists who are interested in sports.  At least, that is my impression after going through the university system in a science driven field -- through an advanced degree program.  The prospect of losing a scientist to the NFL organization at first sight might seem unethical.  Scientists should stick within their field (discipline) right?


Not necessarily.  There might be many benefits by losing data scientist to the NFL.  First, the scientist working for the NFL will inevitably have a appropriate infrastructure to handle the large amounts of data coming in.  In science, funding is scarce and often sought out among many research groups.


I have always maintained that in order to improve the funding for science, we need the entertainment industry and the sports industry to get involved (financially and technologically) to boost the ability of science.  Why?  Not all great ideas come from working on science problems in science.


What do I mean by this last statement?


A famous story about the world famous physicist Albert Einstein revolves around generating his best ideas while shaving.  Successful people will often tell stories of ideas which have been generated about their business while performing outside work or tasks.  The shower or shaving are just two.


Additionally, while performing a job outside a given field, a scientist may gain insight into the problems within their field.  This methodology is sometimes referred to as "thinking outside the box."  By tackling problems associated with dealing with large data sets like players in a game, other problems might be tackled using different algorithms.  Can you think of any?  I can.


One such problem is tracking people in real time in a city and finding potential threats (WM -- chemical and biological weapons, etc.).  Sifting through the data to find meaningful answers might improve the governments ability to sift through data to find a threat.  Although, the funding opportunities to develop an algorithm or simulation might be too costly on part of the city.  Therefore, having organizations such as the sports organizations tackling the data regarding player movement within a given region (on field inside a stadium) will inevitably improve our ability to detect a threat.


As most of us know, the entertainment industry is rich in funding and not at a loss for funding such interesting projects.  Alternatively, new algorithms will be made (which are proprietary for the NFL) to tackle the issue of analyzing real-time data.  But the inherent thinking or structure of mining the data is what is critical.  After that is known, then an algorithm could be changed to achieve that specific problem.  This prospect offers a great future to science and society in the future.


Conclusion...


The correlations which will arise as a result of data mining real-time player information have yet to be realized.  By the descriptions in the cited article above, we are just at the tip of the iceberg in terms of finding relationships within such data sets.  Additionally, no one knows the benefit or adverse effect the data mining will have on both the gaming (gambling industry) and the NFL organization.


Hopefully, out of such data mining algorithms, safer players (with less injuries, etc.) will result.  Science will inevitably benefit out of the data mining processes that are developed.  I have no doubt about that.  Scientists are interested in sports and already use the industry to approach problems in science.  Even if progress is made on the initial thought process of how to find correlations in the data, I believe that meaningful results will arise from the exercise.  Initial findings suggest that this is the case.  Although, as I mentioned, we are just at the 'tip of the iceberg' in the process.  Stay tuned!


Until next time, Have a great day!