Showing posts with label Transportation. Show all posts

Monday, September 12, 2016

Why Is Elon Musk Powering A Freight Ship With A Rocket Engine?

Alright, Elon Musk might not be planning to power a freight ship any time soon with a rocket engine, but he is moving extremely fast with his "overly ambitious" space program.  Do you believe me?  Fortunately, my word does not have to be taken.  According to a news article that appeared in the Los Angeles Times recently titled " Is Elon Musk trying to do too much too fast?" an analyst is quoted with the following view of Elon Musk's progress:


“This raises serious questions about the reliability of the SpaceX launch vehicle,” said Loren Thompson, a defense analyst at the Lexington Institute, which receives money from Boeing Co., a SpaceX competitor.  “They are taking this technology to the limits.” 


Boeing is not a competitor since Lockheed Martin and Boeing formed a relationship called the United Alliance Launch -- that funds SpaceX's adventures.  Additionally, the analyst is speaking in terms of experience.  Regardless of opinion, the pace at which Elon Musk is pushing and promising payloads into space is calling into question the reality of delivering such low cost and reliable delivery.  In order to understand arguments either way, a closer look at the space ship might help us understand the challenges.  As a metric for comparison of the thrust required to project objects into space, a freight ship might suffice.


The post below was written in relation to the terrible accident that occurred on September 1, 2016 in Florida at the Space Station.  Here is a video of the unfortunate explosion that occurred before launch while filling the fuel tanks on the rocket:


In order to understand the magnitude of the disaster shown above, dimensional analysis needs to be carried out.  First, a short discussion of the commercialization of space might serve the reader well as a starting point.


Space Exploration Takes Time, Patience, And Funding!


Space exploration by various countries around the world has been around for decades.  Research and discovery in the area takes a considerable amount of time and funding.  Why?  There exists many reasons that are questionable.  What is not questionable is the fact that NASA has considerable experience and extensive analysis of what works and what does not work.


Furthermore, there has been a decline in funding for NASA projects over the last few decades which is truly disappointing.


What is the thought process behind the decline in funding?


Again, the answers are numerous and questionable.  Another unquestionable certainty is the deliverable technology that is "spun off" from such research and design that hits the market in the form of everyday products ranging from foam pillows (space pillows) to special lubricants (that have a dynamic range of parameters).  Undoubtedly, our lives are better as a result of the R&D that NASA has completed over the last few decades.  There is no question there.


Why commercialize space?


Another fascinating yet open-ended question.  Since the decline in funding, maybe the large aerospace corporations are looking to increase their profit margins back to the point during the hey-day of aerospace R&D.  Regardless, the promises and results that are arising today as a result of the new direction of space flight are making investors and the public uneasy.


Just this week, the space arm of Virgin Airlines -- Virgin Galactic promised to resume R&D testing to send high-paying customers into the upper atmosphere - lower space orbit.  Here is an excerpt from an article in the Los Angeles Times this week:


SpaceShipTwo eventually will be in the business of carrying tourists who have paid up to $250,000 into space. The sleek spaceship will be released at about 50,000 feet by its carrier aircraft, then propelled by rocket to more than 50 miles above the Earth — past the point where NASA and the U.S. Air Force consider a passenger to be an astronaut.

Last summer, the National Transportation Safety Board said the first SpaceShipTwo broke apart because the copilot had opened the aircraft's movable tail, or “feather system,” too early. The system is intended to help the craft slow down after its descent from the Earth's atmosphere.

The NTSB placed most of the blame on the plane's builder, Mojave-based Scaled Composites, which is owned by Northrop Grumman Corp. The agency said the plane's design should have protected against the possibility of this human error.


These types of results are exciting from a possible consumer standpoint.  Although, the loss of life is unacceptable.  Especially, since space and aircraft travel have been optimized over the course of many decades.  What is the difference?  Today's exploration is being pushed beyond limits -- too fast -- I would argue.


New materials and research results are rolling off of the academic press without proper testing before being incorporated into new technology.  This has always been the case with the toxicity of chemicals in consumer products.  The government is finally starting to take a closer look into the matter with the newly update Toxic Substance Control Act (TSCA) reform (different subject -- same concerns).  Dr. Richard Denison of the the Environment Defense Fund writes extensively about the subject -- here.


How do we understand the magnitudes of such discoveries?


Returning to the commercialization of moving cargo into space, can we visualize the feat that is to be overcome in order to obtain success?


As I mentioned above, NASA has devoted a significant amount of time in Research & Design over the last few decades.  I decided to show a few videos of the advancement in testing and construction of critical components that make-up a rocket engine boosting a payload (cargo) into space.  Specifically, I focus on two major components: Fuel tank and Rocket engine booster.


Fuel Tank Construction:


Imagine trying to launch a payload of several tons up into space.  What does such a feat require?  First, the design of the rocket should be sufficient to meet the criteria of getting the cargo into space.  At the very least, the fuel tanks should be sufficient to hold enough fuel to lift the payload into space.


As you will recall in a previous blog post on the gases helium and hydrogen, in order to arrive in space, the molecules of either gas must overcome the gravitational pull of Earth's gravitational field.  The escape speed (escape velocity) was determined to be around 7 miles per second.  Wow!


How much fuel would be required to lift a giant space rocket?


Below is a video of the SpaceX falcon 9 fuel tanks being processed -- taken from the spaceX youtube channel:


Here is a time-lapse video of the construction of such massive tanks from NASA at the Marshall Space Center:


An enormous amount of consideration must be devoted to the design of the fuel tanks.  Especially, when considering the temperature of the liquid fuel (cryogenic temperatures) being consumed.  Remember, the liquid hydrogen needs to be stored at cryogenic temperatures -- at around - 423 F or - 252 C.  That is freezing.  Special care must be taken to avoid any explosion or sudden loss of fuel.  From the time the space craft is filled, the fuel is evaporating.  With the temperatures this cold, it is amazing that the controlled explosion -- i.e., controlled burn -- launch is possible.  Next, lets look at the rocket engine.


What about the Rocket to deliver the thrust?


Rocket Engine Testing:


There is extensive testing of the rocket engines which deliver payloads into space.  Regardless of whether the payload has humans on board or not, the cost is easily seen into the billions of dollars.  Therefore, there should be no surprise at the extensive tests which have to be done before the final rocket goes into space.


Where do these tests occur?


Short answer -- in various places.  Here is a video of a test for the SLS rocket shown vertically:


What is the magnitude of the thrust coming out of the rocket engines?  Around 1,700,000 pounds of thrust -- according to one report.


Here is another test that is done in the desert for a similar system shown below:


If you look closer to the flame, you might be able to see the "compression vibration overtones" -- shown in the NASA recorded video below:


You get the point.  The thrust required to generate an escape velocity of around 7 miles per second is huge.  A significant amount of testing has gone into the space flights over the years.  Couple these videos to the reduction in cost of technology due to advances in materials science.  This relationship gives rise to the reduction in cost projected to get a group of civilians to into space -- not to mention the routine shipping and receiving supplies to the International Space Station.  What is my point?


How does a person visualize the magnitude of the thrust in the rocket tests above?


In order to do so, a metric would be needed.  What kind of metric would serve us to really drive home the point? How about a freight ship?  Lets entertain the idea of the possibility of strapping on the 'two-stage' rocket of the Falcon 9 (that exploded) onto a cargo ship (freight ship).  If the thrust that drives a rocket into space was concentrated onto the back of a fully loaded cargo ship, then the question would be:


With the equivalent thrust of a rocket engine, how fast would the freight ship travel?


Below is the analysis -- enjoy!


A Rocket Powered Freight Ship?


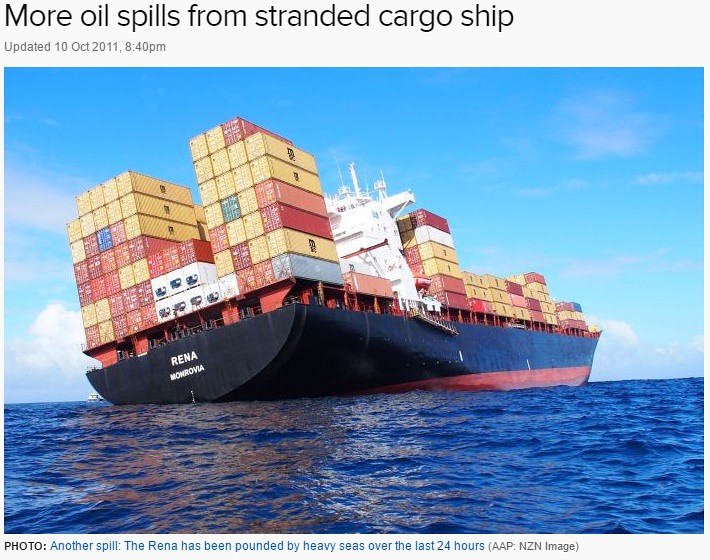
I wrote a post regarding the timeline of the popular news cycle and disasters such as ships running aground on reef's, etc.  The point the post was to highlight the magnitude of such a disaster and how long the timeline is to return to normal business.  In the post, I used a disaster that occurred 5 years ago when the M/V Rena freight ship ran aground a reef.  To drive my point home, the salvage of the ship and cargo have just recently been accomplished.


Additionally, I wanted to point out that the enormous amount of cargo that is able to be carried by gigantic ships contribute to the timeline of returning the ship to normal operation.


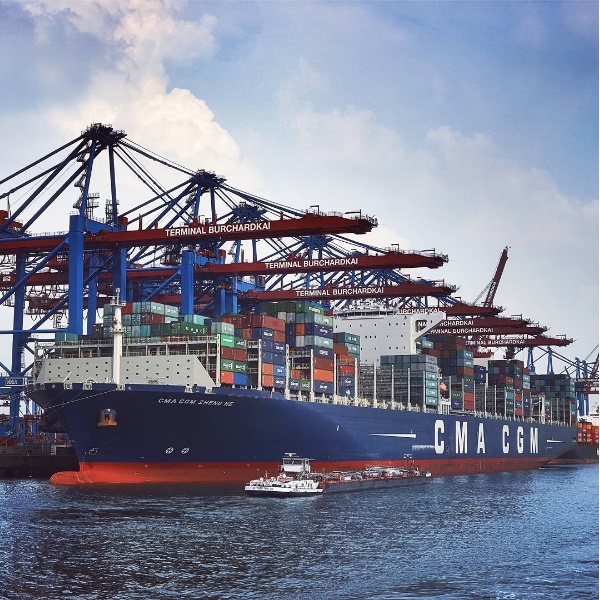
Recently, off the port of Long Beach, a freight ship (Hanjin Greece) was seized to protect the cargo on board against creditors.  The shipping company Hanjin Korea is going bankrupt while their ships are spread throughout the world.  Freight ships vary in weight due to the cargo carrying capacity that they potentially can deliver.  The largest class of container ships (freight ships) are gathered on a list.  Additionally, the largest ships by gross tonnage are compiled on a list too that have some that dwarf the container ships.  Below is a picture of the Hanjin Greece taken from the website "Vessel Tracker":


Why not use the ship for a metric to visualize the magnitude of the thrust coming off of a rocket?


To do so, the ships total carrying capacity needs to be determined.  According to the website "Mariner Traffic," the total gross tonnage of the Hanjin Greece is 114,144 tons.  Wow!   The average speed is around 12 knots.  In order to carry out the dimensional analysis problems, these values will need to be handy.  I will explain shortly.


In order to start the dimensional analysis of determining the possible velocity of the Hanjin Greece using the thrust of the rocket engine from SpaceX, we need to have the value of the thrust of the engine.  According to the official website for the Falcon-9 rocket, the value of thrust is given for each engine along with the burn time.  For the purposes of the calculation, I will use the value of the first stage engine -- which is equal to 7,067 kiloNewtons of thrust -- Wow!


To determine the velocity, we need to have an equation which relates "horse-power" to force.  Power is expressed as the work divided by the amount of time -- in equation form as follows:


Previously, in a post, we looked at the amount of energy (in power) that is contained in a 'kiloton' of energy -- a nuclear weapon.  In a follow-up post, the amount of energy contained in a '13-kiloton' force was investigated - how to visualize the force. The combined content (information) in the two posts set the stage for the derivation of 'horse-power' (power) from a 'force':


How do we determine the amount of work needed to get the freight ship moving toward a certain velocity?


Work is defined as a 'force' over a given distance.  Substituting "Force x distance" into the equation for power stated above gives the following modified equation for power:


In order to determine the velocity, the last step in the derivation involves the substitution of velocity "v" in for "distance/time" to arrive at the following expression for power:


Now, an expression exists for power that has the two relevant parameters: force and velocity!


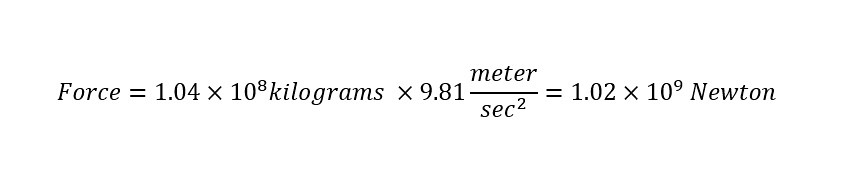
To calculate the force to move the ship, the following expression is used for force:


Fill in the cited values for the Hanjin Greece ship and the constant for the acceleration of gravity to yield:


Next, to determine power, the conversion from units of "knots" to "meter/second" needs to be accomplished.  I decided to ask Google and got the following answer shown below:


Plugging in the value of 6.2 meter/second for the velocity gives us the following power required to move a ship weighing 114,144-tons at a speed of 6.2 meter/second:


To power the boat which weighs 114,144-tons at a velocity of 12 knots (13 miles/hour) or 6.2 meters/second costs around 6.3 billion Watts.  Now that we know the amount of power needed to operate a ship at a given velocity, lets review the initial question regarding the thrust of a rocket.  First, the definition of thrust might be useful.  According to Google:


If the power to push the ship with a given thrust is to be determined, then the velocity possible is needed.  Instead of determining a velocity, how about comparing the relative distances are possible with a given power?  To start with, a rocket engine can burn for around 162 seconds.  If a ship that weighs 114,144 tons were traveling at 6.2 meter/second, the possible distance traveled is calculated below:


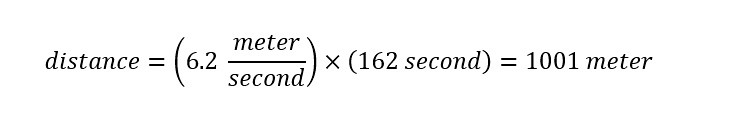
What does the result mean?  At an top speed of 6.2 meter/second, the cargo ship fully loaded will travel 1001 meters.  As I was writing the blog, the question of the blog changed to the following:


What is the relative distance of the cargo ship traveled powered by the rocket engine?


To answer the question, we start by setting the powers equal to each other as follows:


Next, expressing power in terms of a force applied over a distance in a given amount of time.  That is, the amount of work in a given amount of time.  The expression now appears as follows with each side having a subscript letter "b" for "boat" and "r" for "rocket":


Notice that the variable "t" has no subscript.  Meaning, the amount of time is the same.  The rocket engine provides 7,067-kiloNewtons of thrust for a total of 162 seconds.  The following expression is obtained with the relative forces (boat and rocket) in a given time is shown below:


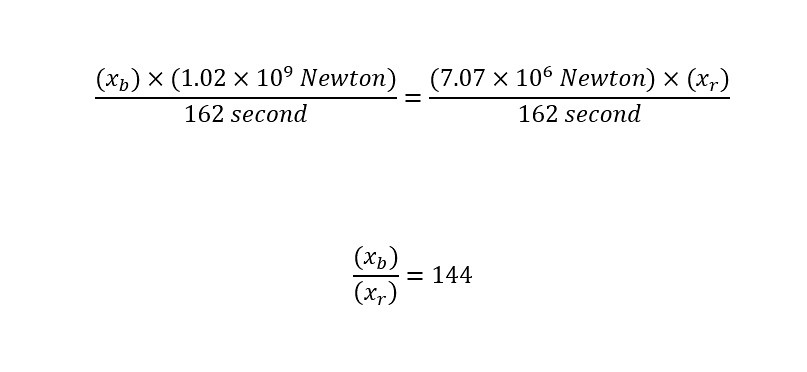
Expressing an equation with two unknowns makes little sense.  Right?  Well, in the above equation leaving the two distances undefined is an exception.  The above equation holds the answer to the blog post.  In the last line, I have expressed the ratio of the two distances: 1) the freight ship travels at 6.2 meter/second and 2) the thrust of the rocket in the 162 seconds of operation -- to yield the result of 144.


What does 144 mean?


The result is that if the rocket ship was employed to push a fully loaded freight ship, the distance traveled in a total of 162 seconds would be 144 times less than the distance traveled in 162 seconds at a velocity of 6.2 meter/second.


Result: In 162 seconds, the freight ship would travel just over 6 meters compared to 1001 meters at 6.2 meter/second.


Conclusion...


Sending space ships into outer space is an amazing accomplishment.  What is interesting to me is that NASA has successfully launched a considerable number of missions over the last few decades.  Now, with the decline in funding for NASA and the conversion of funding coming from the commercial sector, the number of accidents has started to increase.  Maybe, Elon Musk should consider standing back a little and reviewing successes and failures before charging forward.  A small amount of "theoretical optimization" might be of use in the current situation.


So far, there have been disasters in his car company which have resulted in the loss of life.  Hopefully, there will be no loss of life in his space ship missions.  As I have shown in this blog post, the amount of force is three orders of magnitude less than that required to power a freight ship at top speed of 13 miles per hour.  Of course, the considerations are completely different.  The point is that with the different considerations, the timelines should correspondingly be different too.


The space industry is not large.  In fact, according to some accounts, the previously employed NASA engineers have been employed in the commercial space industry.  Since that is the case, coupled with a "new perspective" of the power involved in sending the rockets up into space (as a result of the calculations), we (the public) can demand that the commercial sector change its ways.  The result should be a less reckless commercial industry.  Until next time, have a great day!


Thursday, September 1, 2016

How Much Weight Can The Average Freight Ship Carry?

The news cycle is fast in this world.  Disasters stay in the news a few days -- if the damage is truly extensive.  The recovery from disasters can be long and arduous.  Even though the story might disappear from the news feed, the work to recover might be months or years depending on the extent of the damage.  An immediate example that might come to mind is the recovery from the flooding that occurred recently in Louisiana.  I wrote a blog post regarding the 256 billion gallons of rain that the region received.  On the other end of the spectrum might be the oil rig that recently floated ashore in Scotland -- which I write about here.  Lets explore an intermediate example in the blog post below.


Take for example the following picture shown below:


The image above obviously conveys a major problem that needs to be dealt with.  The picture above is taken from an accident in 2011 -- where the freight ship "Rena" got stuck.  Normally, we would expect to see the following picture of a freight ship shown below:


Or parked in a port ready to be either unloaded or loaded like the ship below:


Returning to the first picture, when a disaster occurs like the one shown above, how does an organization (International, Federal, State, etc.) deal with the problem?  What do you do to remedy the situation?  Obviously, there is a tremendous amount of weight stored on the cargo ship.


Why do I ask such questions?


Cargo On A Freight Ship


The reason that I am interested in asking such questions is due to the "noise" created by the "news" coupled with a devastating disaster -- whether the disaster be natural or man-made.  The "noise" is the news cycle which has reduced the average person's attention span by having us jump from disaster to disaster.  In the example above, the freight ship is stuck in the ocean on a reef.


If an average viewer was to follow just the news cycle, then they might be under the impression that the freight ship was fixed immediately and went back to business as usual.  Through entertaining the amount of weight that an average freight ship might carry at a given time at sea, the perception might be changed.  Or at least updated with further information on which to base an opinion on.


I have been wondering the answer to this question for a long time.  Every time that I see a picture of a freight ship either at Port or out to sea -- I am stunned by the magnificent feat this must be to carry such an enormous amount of weight in a given trip.  A few weeks ago, I was surfing my Instagram account (@mike_thinks_photos) when I happened to run across a picture of a freight ship and was held in amazement once again.  I decided to ask a few question as shown below:


The conversation was attached to the photo shown below:


I cannot wrap my head around a ship (like the one above) carrying a payload of 180,000-tons.  WOW!  That is too much for me to comprehend.  The reason why is based on a previous post that I wrote about the relative weights of the Queen Mary Ship and the Spruce Goose airship created by Howard Hughes.  In that post, the conclusion was drawn that the erroneous excerpt from a tour guide mistook the weight of the Spruce Goose to be 400,000 tons (which was completely off base).  Why?


If that were the case, then the Queen Mary Ship which is pictured below and weighs 96,000 tons would be roughly 1/4 of the weight of the Spruce Goose -- which clearly is not the case:


Source: Wikipedia


Here is another view of the Queen Mary Ship along with the dome which houses the Spruce Goose airship shown below:


Further, if this were the case, then the Spruce Goose would go down in history as the most "fuel inefficient" plane in history and would probably have never been able to lift off the ground.   The conclusion of that blog post was that the "units" of measurement -- weights of each object were clearly mistaken by the author and that certainly can make a difference in the readers mind (not to mention the California Tourist eager to see those attractions).


An additional point to note in the example above of comparing the two objects (Queen Mary Ship and Spruce Goose airship) is the weight of each.  If the Queen Mary does indeed weigh 96,000 tons -- then this can qualify as a 'metric' to use in the current post in regards to casting the weight carried on a freight ship into perspective.


A calculation can be carried out by dividing the two stated values of weight by each other.  That is, divide the weight that is possible to carry on a freight ship (180,000 tons) by the weight of the Queen Mary Ship to get the following result shown below:


Which is to say, that the amount of freight (in weight) that an average freight ship can carry is equivalent to nearly the weight of two Queen Mary Ships -- WOW!


No wonder why disasters like the one above where the freight ship runs aground on a reef are so problematic.  Think about the timeline of getting the ship back to moving cargo as usual.  What steps have to be taken to stabilize a ship that is off-axis as shown in the picture (the first picture)?


Here are a few considerations:


1) How does a crew remove cargo from a tiled ship?


2) How does a crew pull the ship back into the water (if possible)?


3) How does a crew inspect ship for damage?


If we just entertain the three considerations above, how does a shipping company proceed with such a disaster?  If anyone reading this blog post works for a shipping company, please feel free to comment below and give us some insight into the matter.  Seems like an impossible task to me.  I would have the following questions of concern:


1) What happens if the ship moves while removing the cargo?


2) What happens if the cargo falls off the ship while attempting to extract the freight?


3) What happens to the workers aboard the ship while the cargo is being removed?


4) Where is the extracted cargo moved to -- another ship?


Wow! 180,000 tons is equal to nearly two Queen Mary Ships.


Conclusion...


The next time that you see a freight ship like the one shown below:


Stop and entertain the following thought: The amount of weight on that ship could equal nearly two of the ships shown in the picture below:


Furthermore, take a little time to ponder the amount of effort which would be required of salvaging crews to fix a freight ship that had floated ashore or onto a reef (like Rena above).  Additionally, think about the importance of trade routes throughout the world (Suez Canal, etc.).


Why are those shipping routes so coveted?


When the issue is cast into the metric of the amount of weight possible to carry, the problem is quite simple.  The next time that the popular news is filled with "noise" regarding dock workers striking at the Ports which house these ships, stop and think of the volume of cargo that is being held up from moving about the world.  Think of the packages and goods that are being stalled on ships that are waiting at sea to be unloaded.


The above weight mentioned did not include the thousands of tons of oil which was stored on the ship to power the movement of the cargo on route.  Until next time, have a great day!!


Thursday, July 28, 2016

'Wayfinding' Signs Are For Everyone Not Just Tourists!

The concept of a 'wayfinding' sign is typically thought of to assist tourists in a city or a region to get around.  Why do we restrict our thinking to such narrow benefits for a select population?  According to a recent news article, the typical thinking was reported on and struck me as dull -- not really exciting.  Why?  Read on below to find out why.


Wayfinding Signage?


What is 'wayfinding' signage?  What is the utility of such signage?  What does that signage look like?  All of these questions are acceptable in this day and age.  Especially as different urban areas try to transition toward designing downtown regions which motivate residents and tourists to engage in greater active modes of transportation -- when moving around.


Here is an example of a 'wayfinding' sign in Glendale (California, USA) shown below:


Source: Roger Wilson/LA Times


Upon inspection of the sign in the picture above, there is a time printed on the sign and a destination.  In this case, the time that a person would have to walk (7 minutes) from this point to the shops on Brand Blvd.  Here is an image of a map taken from GoogleMaps outlining the distance stated on the sign below:


The sign shown in the picture above was taken from an article in the Sunday 'LA Times' titled "New 'wayfinding signs' encourage pedestrians to take a stroll around Glendale."   Among the paragraphs in the story, three stood out in particular.  The first excerpt highlights the reason for the signs as shown below:


Dubbed "wayfinding signs," the signage along local sidewalks serves two purposes: they contain health tips and point in the direction of local landmarks such as the Glendale Galleria and the Americana at Brand.

"We're thinking they'd be helpful for visitors, people who may not necessarily be familiar with all the sights and attractions here in town, and residents may find a hidden jewel in their neighborhood," said Juan Gonzalez, neighborhood services supervisor for the city.


The City of Glendale has the correct intentions for tourists.  Although, tourists should not be the only audience that transportation experts are targeting.  The overall mission of transportation authorities should be to target everyone living within walking/biking distance (<3 miles) of the downtown area.  Especially, as this mission is aligned with the mission of Measure R2 and with Governor Jerry Brown's vision of engaging a greater population in using active modes of transportation (i.e., motivating active transportation).  For those who are unfamiliar with Measure R2, the measure is a huge transportation bill to be added to November's ballot -- which will supply billions of dollars over the next few decades (read more here).


These distances can easily be traveled safely and quickly by bicycle - but remain unknown to the average resident who mainly relies on their vehicle to travel short distances (which is astounding).  Additionally, the city should be emphasizing the relative distances associated with traveling within the "downtown area" of Glendale.  Here is a map of South Glendale (that is below the 134 Fwy) shown below:


The scale is  located at the bottom right.  As the reader can see, the entire "downtown" area (including residential areas surrounding downtown) spans may 2 miles wide by 3 miles in length (running North to South).  Residents could easily walk and bike around the area where all of the major business is conducted if they had a better grasp of the relative dimensions of the city.


One of the main motivations of writing for this blog site is to demystify reported statistics in the popular news using dimensional analysis.  Viewing a map in context to scale and relative distances, should motivate residents of the area -- not just tourists to walk and bike rather than drive.


In the first map shown above, the time that a person needs to travel from City Hall to Brand Blvd is only 8 minutes.  I wonder how many of the public employees who work at City Hall (Council members and Mayor) walk to Brand Blvd for lunch?  Furthermore, how many of the politicians walk the city rather than drive?  Maybe that is a question that needs to asked of the city in the near future.


The lack of participation in active transportation seems to be mainly centered around awareness.  Residents in the city have not the awareness of the relative times that is required of them to travel the relative distances.  As usual, I try not to bring any subject up if I am unwilling to help in increasing the awareness -- which I have in the past.


How Long Does It Take To Walk Downtown?


Understanding the relative times that is required to travel a certain distance is critical in motivating the use of active modes of transportation.  I have written on this site previously about eliminating the separation of commuting and leisurely trips when it comes to active transportation.   Every trip should be an active transportation trip!


What is our part in the process?


We started the nonprofit organization 'Bikecar101' -- with a mission of the following: to advocate for and educate the public about bicycle on public transit trains.  How does this correlate to the subject at hand -- wayfinding?


and the other video:


In each video, we started the experiments from the West side of town.  From our house, we traveled to the center (to the Americana) and to the East side (to the fountain - second video).  Which means that if residents are willing to walk around a mile each way, there is no need to use a car.


Of course, if the purpose of the trip is to buy groceries (in large quantities) or heavy objects from the mall, that is an exception to the rule.  Think about how much healthier the residents of Glendale would be if there was a higher participation in active transportation.  In the article above, the distance highlighted by the 8 minute walk drove home the point that anyone living in the vicinity of City Hall does not need to drive (every time) to get to Brand.  Plus, here is an excerpt from the article highlighting the health benefits:


As for health tips, one of the signs states that doctors recommend walking 6,000 steps a day to improve one's health and 10,000 a day to lose weight.
There's also a social-media campaign as part of the program. Pedestrians are encouraged to snap selfies of themselves with a wayfinding sign in the shot and share the pictures on social media with the hashtag #GlendaleWalks.


Any person can easily achieve 10,000 steps by traveling using active transportation in a given day.  There is no excuse.  The information is present in the article.  You might ask then the following question:


What is wrong with the article?


Conclusion...


Again, the 'wayfinding' signs are a wonderful addition to the City of Glendale.  I hope that as the transportation experts around the Southern California area move forward in motivating voters to go out and support Measure R2 this November, we remember the overall mission.  It is imperative that the all active modes of transportation be emphasized.  Walking, biking, along with the use of light rail, bus rapid transit affords the opportunity to travel over a wide range of distances here in Southern California.  In order to drive home the concept, each of us advocates need to demystify the distances that are available to walk/bike in our respective cities.


'Wayfinding' signs contribute greatly to this effort.  Although, if each of us do not contribute and explain to our fellow citizen the purpose of these additions (signage), then they will go unnoticed.  Walking/biking is demystified by various exercise groups on the weekends along with local bicycle coalitions (the Los Angeles County Bicycle Coalition hosts a Sunday "Fun day" ride each month).  Working together, come November, Measure R2 will become a reality.  Then the real work continues to be our duty -- spread the word by education to produce a better society.  Each City needs to work together to become a region promoting healthy and sustainable transportation.  Infrastructure and tourism is just one part of a larger solution.


To stay informed on transportation, infrastructure, and advocacy issues in the region read the vast coverage (while up to date) at StreetsblogLA.org.


Friday, April 29, 2016

Los Angeles Was Built On Top Of Oil?

Recently, I came across a video that discussed California's Urban Oil Fields.  Specifically, the story of Los Angeles.


Los Angeles currently has around 5000 active and inactive oil wells throughout the County.  Who would have thought?  A video produced by "Vice News" titled "Crude L.A.: California's Urban Oil Fields" gives us a brief (less than 19 minutes) tour of a few of the facilities is shown below:


The video is definitely worth watching.  There are many valid points that have been brought up which have been in the news in the last few months.  Especially, in the aftermath of the Aliso Canyon Gas (Methane) Leak which adversely impacted residents at Porter Ranch.   I wrote blogs on the disaster --the volume and magnitude of the leaked methane over the course of 4 months.  In light of the gas leak, residents that live near oil wells are asking themselves questions like the following:


Who is looking after our well being (with regulatory affairs) with the oil companies?


Are these wells safe near my house?


What about the chemicals that have been negatively effecting my health?


There has definitely been a light turned on to magnify the inequity of the two situations.  For years, big oil companies have operated in Los Angeles.  As a result, considerable attention is starting to be brought on the oil wells that continue to be used -- even though there are blatant violations (in the form) of inspections.  There has been no oversight from the city to keep these companies in check.


As a result, regulations are violated and have had adverse health effects on the surrounding community.  The communities are composed of thousands of houses.  Residents (activists) of the area need to desperately stand up to politicians and regulatory agencies to take action.  This includes neighborhood councils who have considerable political power.  Although, unless the residents are "united," there will be no change.


The problem is magnified by the fact that the oil drilling platforms are spread throughout Los Angeles and are hidden in some cases.  As I mentioned in the second paragraph, there are roughly 5000 active and inactive oil wells in the Los Angeles area.  How long have they been here for?


Los Angeles 5 Decades Ago?


In the video above, there are a few amazing film "clips" that are truth-telling of the past.  Additionally, the photographs highlight the creation of our dependence on oil.  Oil barons took advantage of land rights and just started drilling everywhere.  Here are a few "still" photographs taken from the film and made into images.


Venice Beach:


Echo Park:


The obvious question after viewing these two photographs would be: Where are all of these oil wells now?  They are in the exact same location.    What has changed then? Lets take a look at the present-day situation here in the Los Angeles area.


Present Day Oil Dependent Los Angeles


The answer lies in the change in technology.  Advancements in oil drilling technology has had many positive attributes for the industry.  Before I highlight a couple that were brought up in the video above, a few pictures of the current situation might help you understand the ability of the technology to change the appearance of the situation.


West Los Angeles:


Beverly Hills:


South LA -- Inglewood:


South LA -- Jefferson:


A gated area with a single crane.  Whereas in Beverly Hills, the residents are completely deceived by hiding the tower in construction.  A similar situation exists in West Los Angeles.  What would occur if the residents knew about the frequency of the wells?  Furthermore, that these sites serve as a conduit for hundreds of oil wells that are tapped in that location.  Here is an example from Jefferson shown below:


And...


The two pictures above are the same area that contains the crane or rig in earlier pictures from Jefferson.  As you can see, the space looks rather empty -- except for tiles on the ground.  Each of the tiles is an oil well head.  Think of the collection of oil wells like a cross section of a wire bundle that is composed of a bunch of strands of wire (each well corresponds to a strand of wire).  The bundle of oil wells drop several thousand feet vertically and then expand out horizontally.  Wow!


Activists and residents are concerned about fumes from chemicals used in the drilling and recovery process.  In the last photo there are visible "containers - large containers" of "solvents" and "acids" which are used in the extraction process.  Here is a diagram below which was taken to illustrate the point of the potential hazards of using such chemicals (acids, solvents, etc.):


Acids are used to break up the oil and make the extraction process easier.  The problem with using these chemicals is the amount of "hazardous waste" generated along with the gases that are given off during the process.  If there was sufficient space between the oil well and the nearest house, an argument might be possible on behalf of the oil companies.  Shown below is a picture of a resident who was interviewed for the article -- who has studied the problem extensively:


The resident is part of the entire neighborhood that is "silently" concerned about these extraction sites all over the city of Los Angeles.  Two blocks away is an elementary school from which children and parents walk home each weekday.


These people are being exposed to "hazardous chemicals" on a daily basis.  The problem is centered around linking the use of these chemicals to adverse health effects.  Additionally, the lack of concern from the politicians and regulatory agencies is not going over great with the public -- as expected.  I use sarcasm due to the astonishing realization that there is a lack of care by these publicly held offices.  Change needs to occur and soon -- very soon.


Of course, the greater question is centered around demand.  If California residents to continue to increase their use of cars rather than public transportation, there will be a corresponding increase in demand for oil.  Which in turn will outweigh potential hazards to the surrounding community.  This is a reality.  According to the California State Board of Equalization's "Economic Perspective," a semi-accurate estimation for annual fuel consumption in 2014 would be around 15 billion gallons of fuel.  California residents drove a combined 300 billion miles annually -- Wow!  Couple this stated statistic to the subject of the blog -- Oil out of Los Angeles and the obvious question pops up:


How much oil is extracted in Los Angeles Annually?


According to various sources, the figure is around 24 million Barrels of Oil (annually).  If we convert the number of Barrels of oil extracted annually into gallons of oil, then a direct comparison of demand versus supply can be carried out.  I show the calculations of the unit conversion below:


According to the results, the amount of oil that is extracted annually is not negligible.  6.72% is important.  Especially, when we consider moving the oil to the refineries and processing and delivering back to the stations (for consumers to suck up into their cars).  Is that worth the danger of a disaster similar to the recent methane leak at Aliso Canyon Gas Storage Facility?  Hard to say.  If you are the resident living near the oil well the answer would be "no way."  Whereas, if you are a resident of Bel Air who lives far away, the answer may be "Sure."


Inequality Seems To Outweigh Reason


The oil well issue has been around for decades as shown in pictures taken from the film.  With the blatant void in the regulatory agency within city hall, one is led to believe (unfortunately) that the situation will not change soon.  At least, not by any politician or regulatory agency anytime soon.  In the meantime, there is another issue that takes up just as great of precedence in the South Los Angeles Area.


That problem is centered around the company Exide that operates a "lead acid battery" plant in Vernon, California.  For an excellent detailed account of the issue see the articles located on the blog Streetsblogs (access them here).  For more information, search "Sahra Sulaiman" for her continuing coverage of the inequality and dangers of this situation.


Exide might have had a less difficult time dealing with the problem of a clean-up if the disaster at Aliso Canyon Storage Facility had not happened.  From a regulatory standpoint, the situation is a disaster.  Whereas from an activist standpoint, the disaster is not great, but is a great starting point to motivate change on part of the regulatory agencies.  Of course, any part of change requires that each of us take action in our own lives.  For starters, we can keep the agencies accountable by asking questions about toxicity, regulatory procedures, and change toward a more sustainable environment.


Additionally, each of us can start looking toward the future with a greater "sustainable" mindset intact.  To start with, we can cut our consumption down of oil.  Currently, the Los Angeles area extracts 24 million Barrels of oil each year.  What if there is a disaster?  Any improvements in sustainability measures might be wiped away.  What part are you doing to solve the problem?  These are the questions that I think about.  Of course, sometimes I think about these questions while driving my car on the freeway while stuck in traffic.  No one is perfect.  Change has to start somewhere for each of us -- individually and collectively.  Have a great weekend.


Wednesday, April 6, 2016

Active Transportation Implies That Every Bicycle Trip Is Considered "Commuting"!

I know -- at this point -- after reading the title you are confused.  In fact, you might be wondering what the blog will be about.  Especially, if you have been keeping up with the blogs written so far this year.  That is an acceptable "state of mind" to have at this moment.  Aside from doing science, I am interested in advocating for greater engagement of active modes of transportation (bicycle, walking, running, etc.) coupled with public transit (buses, but more specifically trains).  To some extent, this process too requires a change of "mindset" toward everyday choices.


As the description implies, engaging in active transportation means elevating ones health invariably while typically reducing the amount of time spent in a car.  Replacing car time with physical activity couple with public transit (trains for our cause) is a viable solution for transportation here in Southern California.  In fact, as will be highlighted, most of the residents are pre-programmed and do not even know it. Additionally, teaching our young to engage in active modes will direct future generations down the line to make policy decisions that involve greater use of active transportation (i.e., public transit infrastructure to accompany greater bicycle storage).  Let me explain a little more to clarify a topic that has been on my mind lately.


What Constitutes A Bicycle Trip?


Recently, the 'Alliance for Biking and Walking' released the 'Benchmark report for 2016' citing the newest bicycle statistics.  I have yet to get through the comprehensive document.  Although, I am looking forward to reading through and seeing the new exciting statistics that have been measured and reported. Regardless of how we display/state the statistics showing increases in bicycle commuters, we need to include those shown in the picture below:


The slide which contains a few bullet points was taken from a slide presentation that I gave last year at the California Bicycle Summit in San Diego (California).  The take home point is that conditioning the mindset of potential bicycle commuters starts at a very young age.  In fact, engaging the young early in choosing active modes of transportation results in better/healthier choices for society and the environment down the line.  Having more people engage in active modes of transportation can elevate the health of the population at large (see American Heart Association statistics in the diagram above -- staggering).


Why are these images important in the picture above?  Read on to find out...


I found out about the report from an article in 'Momentum Magazine' titled "State Of The Bike Walk Union: Here Are The Statistics".  Without going into the details of the report, I want to highlight an excerpt from the article that discussed a couple of statistics contained within the report.  Here is an excerpt that caught my eye:


School-aged children biking to school dropped slightly between 2007 and 2009, but has since been increasing incrementally each year to land at a rate of 2.2% in 2013. However, youth under 16 account for 39% of all US biking trips, while making up only 21% of the US population, suggesting that youth use bikes more often for non-commuting purposes. Which, if any of us were to look back at our childhoods, would have been a pretty easy hypothesis.

Adults 65 and over are underrepresented in biking and walking, which the report suggests could be the fault of community design which doesn’t prioritize biking and walking. While one study cited noted that 58% of seniors would prefer to live in a walkable community, the reality is that 58% (coincidence) of American adults 60 and over live in a suburban community where walking isn’t feasible.


After reading these statistics, my mind drifted off toward a point that I emphasize within my own bicycle advocacy.  Which is that "commuting" needs to be rethought in terms of a reported statistic.  This might not be something new.  But, I think that the above paragraph highlights the need to include other trips in bicycle statistics in order to more accurately represent the motivation toward increasing the funding for bicycle infrastructure within a geographic region and active transportation in general.   Wow, that was long right?


I understand.  At this point, you probably are really scratching your head saying to yourself:


"Where is he going with this thinking?  Where did this thinking or reasoning come from?"


Fair enough, let me explain a little with some background.  Over the last year, my wife and I along with other bicycle (plus train) commuters have been advocating for greater storage space "on board" public transit trains in Southern California.  More about our advocacy can be found at www.bikecar101.com.  Part of the reasoning/motivation was to motivate greater use of an underused train system with the addition of a bicycle to extend the reach beyond the station.  In transportation circles, the problem of extending the reach beyond a "transit" station is called "First and Last Mile."


We tend to think of the majority of trips in Southern California as "First and Last Several Miles" which is more appropriate.  The transit system is underused, which offers a huge potential for growth.  As any person who has visited Southern California knows, the region is filled with "car-centric" drivers (crazy drivers).  Although, with congestion rising on the freeways along with the environmental impacts and health effects, one solution is to motivate greater engagement in using active modes of transportation, hence, "Active Transportation."


This is great -- but -- who cares?  To answer that question, we need to answer another question:


What constitutes a bicycle commuting trip?


I am sure that if I were to ask a bunch of people through a survey, the results would be skewed toward -- "going to and from work."  Although, there are many times other than those only devoted to traveling to and from work where a bicycle could be used?  Why not?  The real question can be stated in the following manner:


When did we lose the sense to choose a bicycle over a car?


If you were to ask an average person how to get around the region (Southern California), generally, the car would be the preferred solution.  What about in a city such as Los Angeles? Still, a car.  Although, the percentages of transit users will invariably vary between different "urban sprawls."  Regardless, lets return to my question above -- when did the typical Southern California resident decide to drive a car rather than ride a bicycle?  When we were given a car?  To get far away from Mom and Dad?


Here are two interesting examples of reasons why every bicycle trip is a commute.


Example 1: A Metro Employee Sees The Light?


When I was young I used to travel to and from the playground by bicycle with friends.  The distance to the playground was around a mile away.   Or, we would ride our bicycles to a field in order to "hit the jumps" in the field -- followed by a two mile ride back.  You could say that I did a lot of bicycle riding in my child hood.  I grew up in Corona (California).  As the town was expanding, the sprawl was increasing.  Still, we rode our bicycles around to play.


I brought this point up in motivating greater storage space (on board trains) at transportation meeting in downtown LA.  Here was the response I got (in the form of dialogue):


Metro Employee: "Do you remember a time when bicycles were not allowed on the train?"


Mike: "Yes."


Metro Employee: "Then you should be happy with the ability to bring a couple of bicycles aboard the train."


Well, that shut me down with the implication: we have done a lot already -- respect.  The problem with that response was that the response did not fit a progressive transit system looking 30 years into the future.  The response was more fitting to that of driving while looking in the "rearview mirror."  I highly discourage trying this while driving for extended periods of time.  Furthermore, this response was an indication of the need for Metro Employees change their mindsets.


All throughout the year, I have been telling this story and the need for change.  Finally, at a transportation summit earlier last month, I asked a question regarding increasing the "on board" storage space aboard Metro trains.  Additionally, I added in the story (the same story) that I had been telling.  Suddenly, the speakers/moderators changed.  I looked up and saw the same Metro employee (who had the previous dialogue) prepare to answer the question.  I thought: "Oh crap, here we go.  Another round of the 'I should be happy to bring my bicycle aboard already.'"  Instead, I was floored with the answer that I received.


She started off with saying the following: "I see that we (Metro) are going to have to change our mindset... the way we view needs of the transit riders."  Whoa!  Oh My Goodness -- great.


She continued on -- with a quick story that contained answers to our questions.  Her son who is turning 11 years old is riding a bicycle around the neighborhood.  She can already notice that his "requests to ride" his bicycle are getting further and further from home.  Now, the pressure has risen for her to consider how to provide safe routes and transportation (bicycle infrastructure on transit) to accompany his bicycle needs.  Each person has a different path of "realization" and this lady had one dealing with her son's new love for biking.  Brilliant.


As I mentioned above, I was much younger when my parents let me venture out onto a bicycle long distances.  In fact, when we were pre-second grade, we rode our little bicycles 2 miles each direction to school -- my sister and I -- crazy!  That would probably not happen today.  The take home message from the first example was the following:


Any bicycle trip can be considered commuting!  Any bicycle trip is important!


Every trip on a bicycle is important and should be considered in a survey offered by bicycle coalitions.  Plus, kids need to realize that their "commute" to the playground is just as important as their "commute" to school by bicycle!


Next example....


For the next example, I would like to be more brief and to the point: stress the importance of bicycling in life to your children.


Example 2: Teach Kids Young To Use Bicycles To Get Around!


I cannot stress this point enough.  Most children do ride bicycles when they are young.  Adults are in control of how that perception lasts through to adulthood.  If a family stresses the need to drive, then driving will reign over all other forms of transport.  Driving will be the default choice compared to biking/walking.  Which is sad -- I think.  Recently (as in a 1/2 year ago) I ran across the picture below on twitter of a small girl walking shown below:


The response below is from myself through another venture that my wife and I are working on which is a wellness center (open sourced practices).  More about that in the future.  As you can see, the mother is a very progressive thinker.  She is integrating health into a commute to the local store and back.  I use the word commute to emphasize that every bike trip is a commute to a given destination and back.  This allows us to integrate a commute to school with a commute to work with a commute to the athletic facility to swim.  Each of these involves deciding to use an 'active mode' of transportation rather than driving.


Can you imagine the mindset of the child above in the future?  Given the task of going to the store, her first choice being to walk.  What a healthy way to live?  Each of us should try to implement this decision making into our own lives?  You might be thinking that the mother above is in the 'minority' instead of the majority of cases.  Here is the last story to drive home the point.


In the picture below, I show a bicycle instructor at a local bicycle event that we participated in back in October of last year:


The workshop was to teach kids how to maneuver through an obstacle course while displaying the proper hand signaling.  Additionally, each child was able to bring their own bicycle to the event and have the bicycle inspected/adjusted by a bicycle mechanic.


Why do I bring this workshop up in relation to the present blog post?


I was standing watching the children and a mother standing nearby looked over at me and said "Thank you for putting this workshop on."  Surprised, I said "Oh, your welcome, our pleasure."  She went on to convey the importance of bicycling in her life.  She stated that both her husband and herself do not ride bicycles much (barely) and are afraid to go out onto the street.  Furthermore, she wanted her children to have two basic skills to grow up with.  These two skills were critical to survival.  The first is that her children must know how to swim.  Second, she wanted her children to be able to ride bicycles.  Wow!  Awesome, but why?


She said that she looks around herself and sees that as traffic gets worse, there will be a greater need to be able to get around by bicycle.  Additionally, she wanted her children to stay active.  At the very least, she could make them ride their bicycles to school to get exercise.  Plus, she said that active transportation was good for the environment.  At that moment, I stood there amazed.  I almost did not believe her.  But she was genuine.


Conclusion...


If the bicycle culture is going to grow enough to support active transportation on a level that will reach a national level, there definitely needs to be a change of mindset among each of us.  Even growth within a region requires attention that is devoted toward changing the mindsets of its residents.  Every trip is a possibility to engage in an active mode of transportation.  Choose to be active rather than passive in deciding your next mode of transportation.  Incorporate health and wellness into your decision.  Break down the barrier of categorizing trips (i.e., "we ride your bicycle to the park but we drive to school!").  There are a few different ways to achieve this.  Similar to the education system in the US, there has to be a component that emerges out of the household.  Education on part of parents toward youth is critical toward growing a society of healthy and responsible while at the same time being environmentally responsible citizens.  This education starts early.


Second, the education lies on each of us to teach our fellow friend, family member, neighbor, boss.  Spread the word regarding the benefits of engaging in active modes of transportation.  The dissemination of knowledge among the region will transcend cultural boundaries too.  Choose to be an example of engaging in active modes of transportation.  Over time, your elevated health and wellness coupled to the reduction of stress  will be contagious and be acted upon by your fellow friend, family member, or colleague.


Overall, the result is better choices that are more environmentally friendly, and ultimately are more sustainable for future generations to carry on.  The next time that you have to go to the store or on an errand, take a bicycle or walk.