The devastation is without question. What is questionable is the preparation of emergency agencies based on knowledge a few days (weeks) earlier with the disaster that unfolded in Haiti. Haiti received an enormous amount rain -- which I wrote a blog about last week. The amount of rain was so large that the summer storm in China which received a whopping 580 billion cubic feet was eclipsed by 750 cubic feet of rain.
Using the same approximations (land area, average rainfall, etc.), lets calculate the amount of rain that the East Coast has received to get a better grasp on the terrible Hurricane Matthew that has ripped apart and drenched parts of the world.
East Coast Receives Rain
As if the devastation to Haiti was not enough to contend with. But Hurricane Matthew continued to drive up into the United States. Various news accounts have given numbers which allow us to approximate and estimate through dimensional analysis the terrible amount of rain that have plagued regions.
To accurately assess the total volume of rain that has dropped on the entire East Coast as a result of Hurricane Matthew, each of the weather stations would have to report an average amount of rainfall across their respective region. Not every region has the capability or funding to do so unfortunately. Therefore, we have to rely and approximate based on whatever values are reported. Hopefully, in the future, this disparity will change and weather prediction and storm forecasting will benefit to a large extent from such positive change. The example I will use below is of the tremendous amount of rainfall that has hit the state of North Carolina in the last few days.
According to the news site 'NBC News' in an article titled "U.S. Death Toll From Hurricane Matthew Rises to 17 Across Four States" reports were given of amounts of rain (listed in inches) fall to various regions:
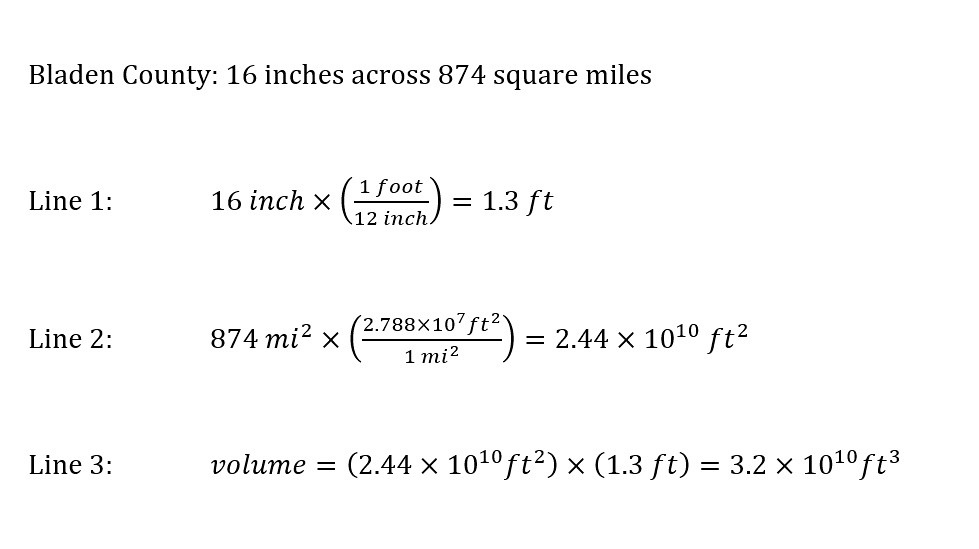
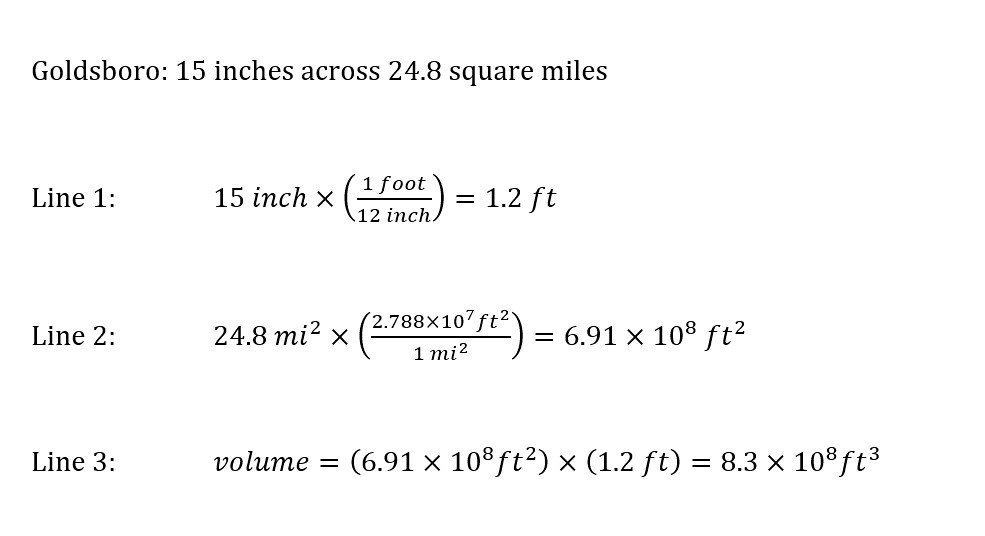
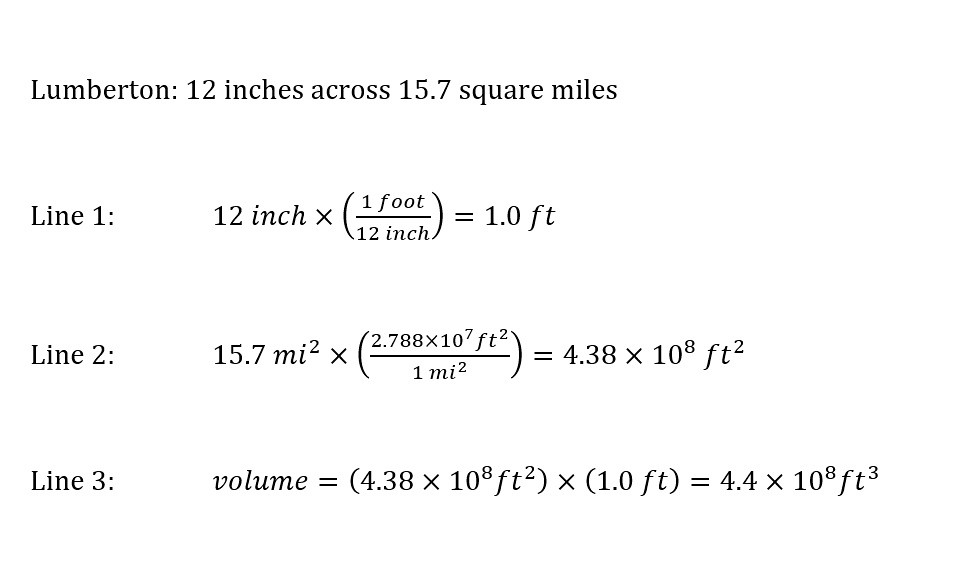
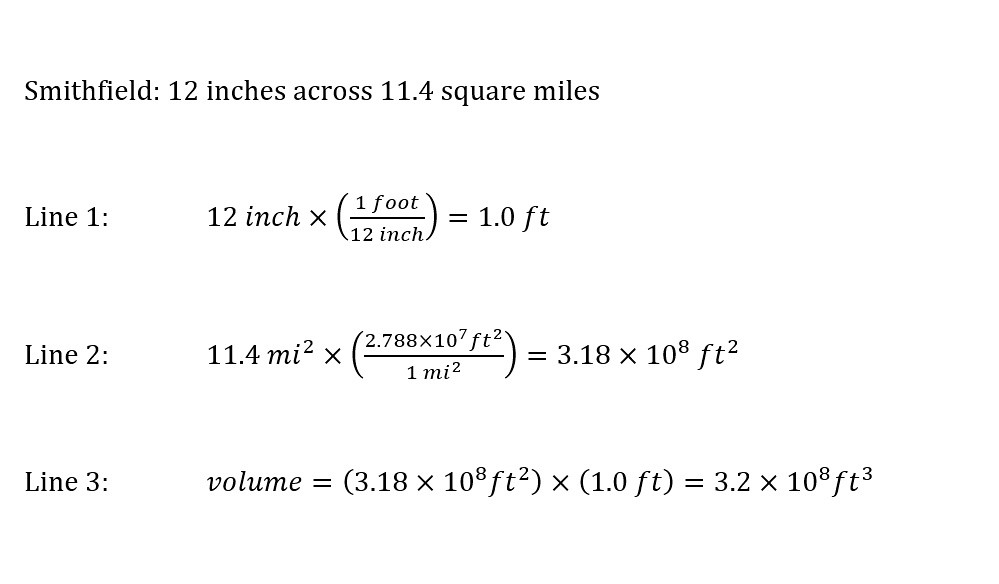
By Saturday night, rainfall totals were 16 inches in Bladen County, 15 inches in Goldsboro, 12 inches in Lumberton and Smithfield, and 9 inches in Raleigh and Rocky Mount, McCrory said in a statement.
After reading the above statement regarding the amount of rain that fell on various counties in North Carolina, you might not be shocked. Picture says thousands of words. Remember that rain was not the only component that made up the devastating impact of Hurricane Matthew. The other destructive component was the wind factor with speeds reaching into a hundred miles per hour in some places.
Compounding the destruction from rainfall alone, the wind can add to the destruction by imposing a force to be reckoned with. Below is a video (just over a minute) from 'YouTube' to illustrate my point:
Watching the video above really drives home the destructive power of wind. Too often, people watching the storm from a television cannot comprehend the effect of wind in a given storm. Although, after rain has fallen or in combination with, wind can have very devastating and destructive effects on a given geographic area. Especially, if the area is not built to receive that much rain. This was the case with a storm in Elliot City (Maryland) earlier this year.
In order to understand the extent of the damage, a few calculations can be performed. As I mentioned above, we can use the logic and approximations that we have assumed in earlier posts on this site. First, we can find out the geographic area by looking in the 'Wikipedia' sites for the counties and regions listed in the excerpt above. Using the same methodology as in previous blog posts of calculating a volume from the product of the area (geographic land mass area) and the height (of rain fall), a total volume will result from our efforts using the expression below:

I will list the area (in square miles) and height (in inches of rainfall). After performing the conversion of square miles to square feet along with converting inches into feet, a final calculation can be performed. We can plug the values directly into the expression to obtain a volume.
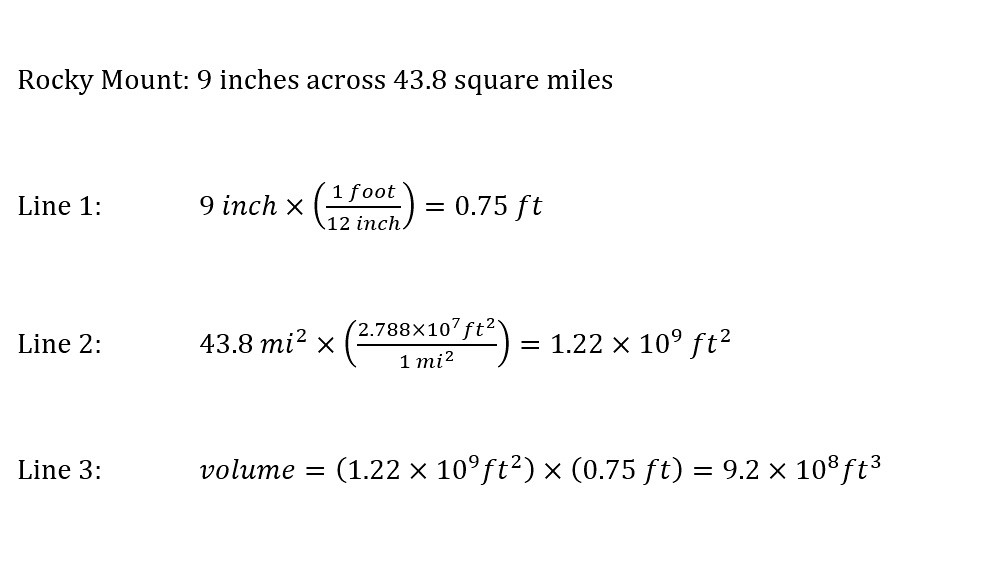
Six regions were listed in the excerpt above: Bladen County (874 square miles), Goldsboro (24.8 square miles), Lumberton (15.7 square miles), Smithfield (11.4 square miles), Raleigh (142.8 square miles), and Rocky Mount (43.8 square miles). It is important to note that each of these regions have a water component that was not included in the geographical area calculation. This would increase the area of each region. Additionally, the water component exacerbates the effects of a Hurricane like Hurricane Matthews.
Again, the outline of the calculations below will be as follows:
1) Line 1: Conversion of units of rainfall - from inches to feet.
2) Line 2: Conversion of units of land area - from square miles to square feet.
3) Line 3: Volume of rainfall - land Area multiplied by Height of rainfall.
With the values and order of calculations/conversions listed above, we can now calculate a volume for each region as shown below:

The volumes listed above are enormous in magnitude which are based on the reporting of the devastating effect of Hurricane Matthew in North Carolina. As I mentioned above, the state of North Carolina has waterways dispersed throughout the state as illustrated below from 'Wikipedia':

Source: Alexrk2
The East Coast has received an amount of rain that has so far claimed the lives of 18 people (in North Carolina). Understanding the magnitude of such disasters gives the reader an idea of the force of destruction that such disasters bring with them. The news cycle is short compared with the long-term recovery process of natural disasters. The need for accurate reporting and transparency is critical to convey the need for greater infrastructure for future disasters. Disaster preparation is achieved through transparency and education.
Just in the last six months, the world has seen rainfall that is beyond comprehension in various areas of the US and beyond. In the paragraphs below, I decided to illustrate the natural disasters in a different light. The metric I have chosen is appropriate to some degree to illustrate the large volume of rain that has so far fallen on the East Coast.
How Many 'World Largest Pools' Could Be Filled?
The values reported above are enormous. Well into the billions of cubic feet of rain have dropped onto North Carolina. If the volume of rain that has dropped onto the six regions is accurately representative of the total rainfall that has dropped onto the entire East Coast, then the total amount is just simply incomprehensible -- to say the least.
When such enormous amounts of volumes are encountered, an appropriate metric is the "World's Largest Pool." This giant structure has been used frequently on this site -- starting with the first time last year. Two pictures are shown below for a reference from the website 'Huffington Post':

And ...

Source: Huffington Post
The total volume of this mega structure that has the title of the "World's Largest Pool" is a whopping 60 million gallons. Yes, you read correctly. In the image above, a sail boat is shown in the middle. Alternatively, there are hotel structures in the first image to give a reference to the size of amazing feat.
If we wanted to calculate the amount of rain in each region mentioned above in North Carolina during Hurricane Matthew, we could easily. First, each volume would have to be converted from cubic feet to gallons. The conversion would allow us to directly compare each volume as an integer value. That is the ratio would be expressed as an integer value of the "World's Largest Pool." From here on out, the "World's Largest Pool" will be abbreviated to "WLP".
Without further ado, lets figure out how many of the WLP could be filled with the respective volumes of rain. One example calculation will be shown for the region of Bladen County in North Carolina. All other volumes will be displayed in a table after.
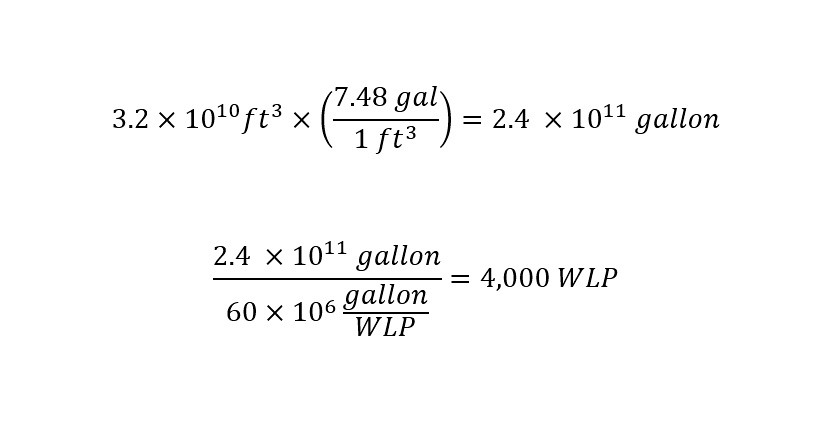
Just when you think that the numbers cannot get any larger, casting the values in different units (in this case US gallons) does just that. Furthermore, as the result suggests, the amount of rain that fell onto Bladen County is enough water to fill 4,000 of the "World's Largest Swimming Pool". WOW.
Using the "World's Largest Pool" or WLP as a metric really changes the volume of water. Before the calculation, all that we were left with from the calculations in the first section were enormous amounts of rainfall expressed in units of cubic feet. With the calculation above, one can easily view the pictures of the WLP and try to make sense of the number. Furthermore, if that amount of water fell on any geographical region, there would be damage.
As I promised above, I would provide a table with the equivalent information as calculated above for other recent storms. Think about the following storms which have been covered on this blog site: China, Elliot City (Maryland, USA), Huauchinango (Mexico), Louisiana (USA), and Haiti.
Here is the table with the values as promised above for comparison:
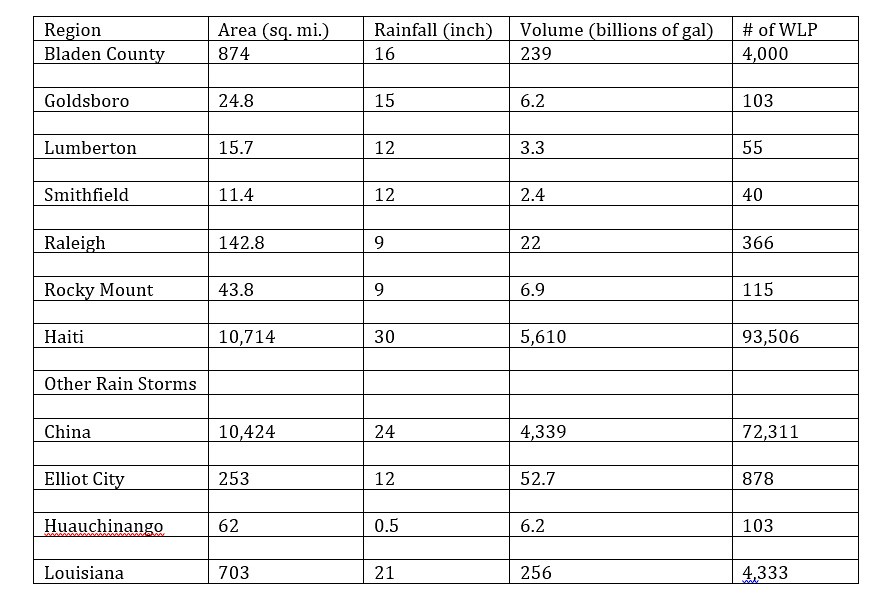
The importance of showing all of the data on the storms is to illustrate the damage caused by different amounts of rain. Each storm is different. Which is why the continual update of weather models needs to be sought after. Similarly, more money needs to be devoted toward improving storm calculation programs. Additionally, more technology (sensors, stations, drones, etc.) need to be deployed to pick up data and feed the data back into the models to improve accuracy.
The tragedy caused by the storms this year so far are enormous and incomprehensible.
How do we move forward as a Nation?
As a World?
What about Climate Change?
Are these linked in some manner?
These questions remain open ended along with others. Although, as long as we move forward as a world thirsty for knowledge and thoughtful/mindful about the magnitude of such disasters, change can proceed in the correct direction. Too often each of us proceed throughout our day with large amounts of stress and anxiety. We do this without considering another force, the force of nature. The force of nature can compound our stress and anxiety by hundreds of orders of magnitude. Think of those put out of their homes by the storms recently as you stress at work. Take a minute to think of those without power or water or a house. Have a great day!