Showing posts with label disaster. Show all posts

Monday, December 19, 2016

How Much Water Is 55 Billion Gallons Of Rainfall?

As the water season began (at least that is what is reported by the news) in early October of this year, news accounts will be arising discussing various rainfalls.  Certain accounts will detail the much needed rainfall while others might even scare readers of the excess rain and the damage that might follow.  Regardless, the way the news agencies reports rainfall is often misleading and uneventful.  Below, I discuss one example from the "Los Angeles Times."


How Is Rainfall Reported?


Over the course of the last year, I have started to write about the reporting of rainfall.  I am constantly amazed at the subtlety with which large volumes of rain are reported after a given storm.  This problem of mine started back near the end of 2015 -- after reading a report of a storm.


Before I get into the initial motivation to investigate news reports about volumes of rain fall, I would like to say that I am still baffled why the news reports "inches" of rainfall while total volumes in units of "cubic feet."  I would prefer the units of total rainfall reported in units of "gallons" -- personally.  The reason is that I can visualize using a few metrics (large volumes -- pools, stadiums, etc.) to compare the reported values to.  Although, one could argue that my request is just unique to me and I could just as easily perform dimensional analysis to get the units that I feel comfortable with.  Fair enough!


During the end of the month of December of 2015, large volumes were reported and I wrote an initial blog post about this rainfall in following month.  Accuracy was not the first and foremost during this storm -- which concerned me.  The reason why is in the numbers.  Let's take a look briefly at the reported numbers which in some cases were skewed or miscalculated.


In that blog post, the news reported a number based on the weather service of 65 billion gallons of water from a single storm -- which is an enormous amount of rain.  One of my family members told me this factoid and stated that 65 billion gallons of water equated to increasing the water level of Lake Tahoe by 6 inches.  Meaning, that enormous amount of rain if collected and poured into Lake Tahoe would result in an increase of 6 inches of height to the lake.


After hearing that number, I sat back and thought -- Wow -- that means that Lake Tahoe is larger than I thought.  This factoid bothered me for a few days.  As a result, I decided to carry out a few calculations which are shown in the blog post.  I will get to the point.  The result of the calculation gave a volume that was very different than the volume reported by the news.


What was I to make of this disparity in volumes?


Did I make a mistake in my calculation?


Did my approximation not make sense?


Check out the blog to understand my full thought process in calculating using a simple approximation -- that of a cylinder.  The result of the calculations revealed that the total volume of rainfall in that particular storm was 6.5 billion gallons NOT 65 billion gallons.  A factor of 10 different in the reported statistic.


Should we be concerned by the lack of accuracy in reporting?  


Yes.


Two major results came from that practice:


1) The volume I calculated was correct.


2) The weather station corrected their reported volume after checking their calculation.


3) I learned a better method by which to perform dimensional analysis of rainfall using reported volumes.


Out of this exercise came the correction of the weather station.  Again, all of this is in the blog post.  Additionally, I learned that method by which the weather stations use (one of the methods) to calculate the volume of rainfall in a given storm.


After carrying out the exercise and writing the blog, I decided that from that point on forward, I would watch news accounts of rainfall volume in the future.  Further, I would look out for reported statistics and try to put them into perspective for the reader using dimensional analysis.  The result has been the blog posts that make up this site.


The results of previous blog posts this year so far regarding the total volume of rainfall have been collected into a table shown below:


Note: Click on any of the cities to access original blog post (with calculations) on this site -- (1) Bladen County, (2) Goldsboro, (3) Lumberton, (4) Smithfield, (5) Raleigh, (6) Rocky Mount, (7) Haiti, (8) China, (9) Elliot City, (10) Huauchinango, (11) Louisiana -- and I forgot (12) Macedonia


The first seven storms listed in the notes above are a result of Hurricane Matthew which ripped through the Eastern part of the USA originating from Haiti.  The last five storms listed are storms that have occurred due to unusual rainfall this year.   Recently, the Associated Press covered this in a story about the National Oceanic and Atmospheric Administration released report on rainfall this year around the world with implications toward Climate Change.


Regardless, the enormity of the storms are worth writing about.  With that in mind, let's move onto the reported value of rainfall over the season thus far in Folsom (California) of 55 billion gallons so far.


How Much Is 55 Billion Gallons Of Rainfall?


In a recent story in the 'Los Angeles Times' titled "A tale of two droughts in California: Wetter in the north, still bone dry in the south" the disparity of rainfall between Northern and Southern California was discussed with varying numbers reported which would make a person mind spin.  One excerpt that stuck in my mind was the following regarding rainfall received in Folsom:


The recent rains were enough to force federal officials to begin releasing water from Folsom Lake to protect against flooding for the first time since March, said Louis Moore, a spokesman for the Bureau of Reclamation, which manages the reservoir. Since the beginning of December, Folsom has risen more than 20 feet — an increase of about 55 billion gallons.


Now, if you are a reader of this blog, then the number 55 billion gallons should stick out of the excerpt above along with the number 20 feet.  Further, with the previous blog posts on this site, you will understand my need to understand the magnitude of large numbers like this.  Numbers that are truly incomprehensible.  I believe that the value of 55 billion gallons of rainfall qualify for the analysis typically found on the site.


To start such an analysis to put the enormous number into perspective, a metric is needed.  A metric serves as a 'ruler' of measurement.  Metric's specifically take away all ambiguity when defined.  What?  I know that is confusing.  Basically, we need a measurement to compare the volume too.


Let's choose 3 volumes and see how the statistic of 55 billion gallons compare.  The 2 volumes will be: 1) World's largest pool  2) Lake Tahoe.


1) World's largest swimming pool:


To start an analysis of the volumes is to ensure that the 'units' of measurement are the same.  That is, for the example at hand, the volume of the World's Largest Swimming Pool needs to be expressed in units of 'gallons' to be directly compared to the volume reported above of 55 billion gallons.


The World's Largest Swimming Pool is shown below:


Source: Twisted Sifter


The volume of the enormous swimming pool is a whopping 66 million gallons.  That is huge.  If we express the volume of rainfall reported in the article in scientific notation, the number would look like the following shown below:


Remember, if the volume were written out in long form, the value would appear as follows: 55,000,000,000 gallons!  Expressing the number in scientific notation allows us to express the number in a compact form.  The volume of the World's Largest Pool can be expressed similarly in a compact scientific notation.


Since the units are of the volume are expressed in 'gallons' -- the number of swimming pools that could be filled with 55 billion gallons of rainfall can be directly determined by dividing the two volumes as shown below:


Wow!  The result can be interpreted as the following:


55 billion gallons of rainfall would fill 830 - World's Largest Swimming Pools!!!!!!!!!


How does one visualize that number of swimming pools?


Note: Since my last blog post using swimming pool in San Alfonso del Mar -- another pool built by the same company has built the new "world's largest swimming pool" -- Crystal Lagoon located in Sharm-el-SheikhEgypt.


Can you visualize a total volume of 830 of the above pools?


I cannot.  Maybe another metric is needed to better grasp the enormous volume of rainfall.


Sometimes our choice of a metric does not necessarily cast the volume in a graspable light.  For instance, trying to visualize the total volume of 830 World's Largest Pool combined is too difficult.  Maybe another analysis is useful with a larger metric to cast the volume is needed.


 In order to get a better grasp of the volume, a larger volume is needed to serve as a 'metric' to compare enormous volumes too.  55 billion gallons is not a typical volume.  Therefore, a larger volume is needed.  On a previous blog post on this site, Lake Tahoe has been used as a metric for extremely large volumes -- which this qualifies as that category.


Below is a picture of Lake Tahoe from Space:


Source: Snow Brains


Upon inspection of the photo above, Lake Tahoe is a huge lake.  The total square area of the Lake is 191 square miles.  In order to use this value as a reference to cast 55 billion gallons of rainfall into perspective, a little math will have to be performed.  But, we will take the process slow.  If at any point, you (the reader) need clarification, please leave a comment in the blog post below.


To start with, an equation for the volume of Lake Tahoe is needed.  Above, the surface area of Lake Tahoe is given as 191 square miles.  An expression (or equation) for the volume of an irregular shape like a lake is the following:


According to the expression above, the volume can rainfall can be determined by knowing the amount of rainfall that a storm delivered across a surface.  Meaning, if a circle is the two-dimensional surface, then by understanding how much water fell on the circular surface, the determination of the volume of a cylinder is possible.  By the way, the units of volume are 'cubic feet' or 'cubic mile' - etc.  Cubic feet is most likely easier to visualize -- since most of us have an idea of the dimension of a foot is in comparison to inches of rain.


Since in the present case, a volume is known, then in order to understand the magnitude of 55 billion gallons the question becomes the following:


How many feet would Lake Tahoe rise if 55 billion gallons were dumped into the Lake?


In order to start the calculation, a unit conversion is required to move on.  The second line of the volume expression states volume in terms of 'units of miles'.  This is not useful when discussing rainfall -- which is usually reported in units of 'inches'. If the calculation is carried out with units of 'miles,' then the results of the calculation would be expressed in 'miles' -- which would be difficult to interpret.


Rather than get an answer that is difficult to interpret, a conversion can be performed to units of feet from miles.  There are 27,880,000,000-square feet in a square mile.  With this conversion factor available, the units conversion is easy and shown below from square miles to square feet:


Next, take the answer (in square feet) and plug the value into the original volume above:


Shown above is an expression for volume with a value for the area (191 square miles) inserted.  There are still two unknowns left -- volume of rainfall and height.  In order to plug a volume into the above expression, a 'unit' conversion is necessary from 'gallons' to 'cubic feet'.  There is 0.133681 cubic feet in 1 gallon.  With the conversion factor in hand, the conversion is simple as shown below:


Next, if the volume of rainfall is plugged into volume equation above, we are left with one equation with one unknown (height) as shown below:


If we rearrange the above expression to solve for height from the total volume, we get the following:


Wow.  The following result states that if 55 billion gallons of water was dumped into Lake Tahoe, the water level would rise 1.4 feet in total.  That is just under 18 inches (1.5 feet).


Can you visualize the change in height?


Of course - why?  Because, I am 5 feet 7 inches tall.  I could stand next to the Lake (shown below) and visualize roughly the water level rising to my knees.  I can easily imagine Lake Tahoe filling up by 1.5 feet.  What I did not realize is that Lake Tahoe is enormous.


Further, take that measurement and look out onto the Lake and the visualization of 55 billion gallons comes into focus.  The choice of Lake Tahoe as a metric fits the dimensional analysis much better.  Half the battle in performing dimensional analysis problems is choosing the correct 'units' and 'metric' by which to compare the stated (reported) value in the popular news to.


Again, here is another picture of Lake Tahoe shown below (not from space):


Source: Lara Farhadi


Conclusion . . .


In the paragraphs above, a couple of metrics (world's largest pool and Lake Tahoe) to cast the enormous volume of 55 billion gallons of rainfall into perspective.  Both volumes represent two extremes of the entire spectrum.  Using the process of dimensional analysis, we were able to compare the volumes to the reported volume of 55 billion gallons.  Prior to this analysis, any attempt toward understanding the true magnitude of the statistic.


Too often, reading the news results in a lack of understanding of the true magnitude of large numbers.  Whether these numbers represent volumes, heights, miles traveled, electricity generated, there is a need to try to understanding them.  The avenue by which to do so is through 'dimensional analysis'.  The process is rewarding when you arrive at a result.  Regardless of the result.  Often times, more thought and analysis is needed to make further sense of the statistics.


Until next time, Have a great day!


Saturday, November 5, 2016

Does Oil Demand Restrict The Amount Of Safety Regulation On Big Oil Companies?

If the last few decades are used as a litmus test, the following questions can be raised regarding large oil operations inside the United States:


Does our demand out strip our ability to provide safe oil/gas to various parts of the U.S.?


Have regulators lost control of the ability to regulate large oil companies?


How many more oil/gas spills must occur before meaningful change can occur?


The above questions are real and meaningful to each of us.  Below is evidence that these statements might be true or stand to be questioned.


Man-Made Disasters


There is no question that the world demand for oil is out of control.  By out of control, I mean that our dependence on oil is so large that the flow of oil around the world is imperative and not an option.  With the rise of research and development into renewable fuels/energy, the options could change depending on the magnitude of the output of such emerging technologies.


How big is our dependence on oil?


What is the daily dependence of oil on the world scale?


How about a developed nation like the U.S.?


I wrote a blog about the magnitude of the world daily usage of oil a few months ago.  The estimated number of barrels required to fuel the world is around 94 million barrels of oil per day.  In the blog post, I point out by using dimensional analysis that 94 million barrels of oil is equivalent to 4.23 billion gallons of oil per day.  A metric that is commonly used on this blog site is the Mercedez Benz Super Dome shown below:


Source: Nwill21


Which has interior space of 125,000,000 cubic feet of interior space which looks like the picture below taken from 'Wikipedia':


Source: David Reber


Just imagine, nearly 5 Super Domes (4.6) could be filled with the daily Global demand of oil.  WOW.  That puts the global daily demand of oil into perspective.  If you are interested in viewing the calculations, click here to access the post.


What about the U.S.?


The daily oil demand for the US is estimated to be around 19.4 million barrels per day.  With a conversion factor of 42 gallons of oil per barrel, the calculation of the conversion is possible as shown below:


The daily U.S. demand of oil is 814 million gallons a day. Wow.  Further, the oil demand is dispersed throughout the entire U.S. for consumption.  This begs the question:


How does the oil get distributed throughout the U.S. to meet the daily demand?


The three major avenues of distribution are shown below:


Truck:


Rail Car:


And finally, the most popular form of transport is the 'pipeline' shown below:


Source: Greenbiz


There is no doubt that each form of transportation involves an inherent risk associated.  Over the last couple of years, the oil pipelines have become a hot topic of dispute.  Just recently, a protest has been brewing in North Dakota over the proposed pipeline.  The energy company 'Energy Transfer' wants to run a pipeline through North Dakota underneath a water supply for the Standing Rock Sioux Tribe.


In a blog I wrote last week, I discussed the battle that has erupted over the pipeline.  An article I quoted from 'The New York Times' cited the two following statements regarding pipelines and the safety surrounding them:


Amount of pipeline in the U.S.:


The United States has a web of 2.5 million miles of pipelines that carry products like oil and natural gas, pumping them to processing and treatment plants, power plants, homes and businesses. Most of the lines are buried, but some run above ground.


Safety of pipelines:
Energy companies and their federal overseer, the Pipeline and Hazardous Materials Safety Administration, promote the safety record of pipelines. Pipeline companies say it is far safer to move oil and natural gas in an underground pipe than in rail cars or trucks, which can crash and create huge fires.

But pipeline spills and ruptures occur regularly. Sometimes the leaks are small, and sometimes they are catastrophic gushers. In 2013, a Tesoro Logistics pipeline in North Dakota broke open and spilled 865,000 gallons of oil onto a farm. In 2010, an Enbridge Energy pipeline dumped more than 843,000 gallons of oil into the Kalamazoo River in Michigan, resulting in a cleanup that lasted years and cost more than a billion dollars, according to Inside Climate News.

In a 2012 examination of pipeline safety, ProPublica reported that more than half of the country’s pipelines were at least 50 years old. Critics cited aging pipelines and scant federal oversight as factors that put public health and the environment at risk.


In the same post, I pointed out that the amount of oil is far less in a given accident by fuel truck compared to a break in the oil pipeline.  A typical fuel truck carries (less than 4,000 gallons) along with a rail car (train car capacity is around 33,000 gallons per car).  The article out of 'The Times' used in the post cited a daily volume of around 470,000 barrels would be moved throughout the pipeline.  That equals around 19.7 million gallons per day being pumped through the pipeline per day.  See post for calculations!


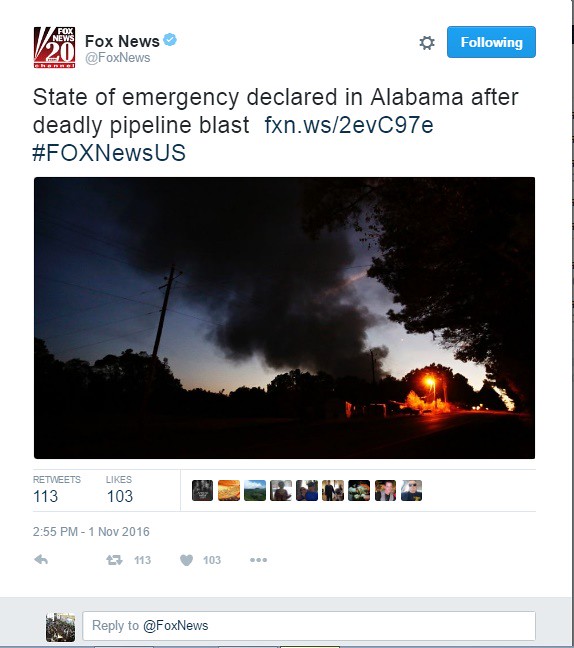
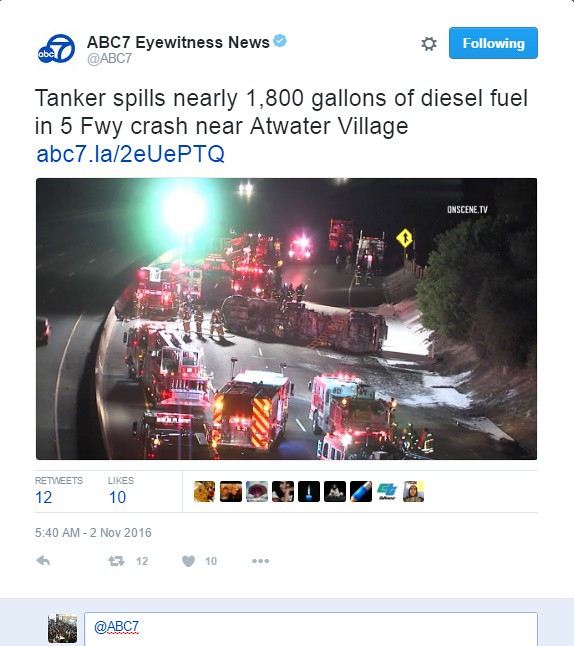
Now, compare the relative volumes being transported by each method.  Here are two images of 'Tweets' that appeared within 24 hours of me publishing the previous post shown below regarding disasters brought on by transporting oil/gas:


Tweet 1:


Tweet 2:


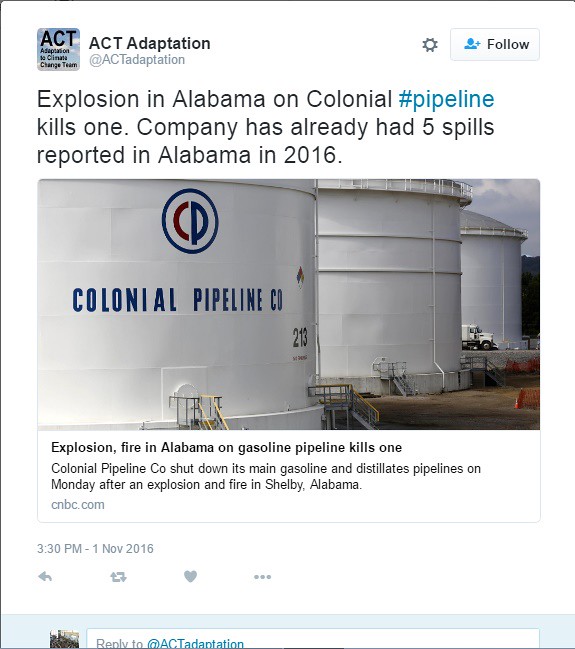
In the first tweet, a pipeline exploded and caused great damage to the surrounding area.  Whereas in the second tweet, a local fuel truck tanker overturned and caused a spill of 1,800 gallons.  Further, a couple of years ago, the company whose pipeline broke due to an explosion has had multiple (5 violations) so far in 2016 as shown by the tweet below:


The energy company 'Colonial' just had a pipeline burst a couple of months ago which spewed around 6,000 - 8,000 barrels of fuel spilled into the forest.  I wrote a blog post about the spill.  According to the company, the spill was small (supposedly) in comparison to others in recent history.  You don't say?


In comparison to the volumes listed in the excerpts above from 'The Times' article which I used in a previous post, Colonial would like you to think the spills are small.  As I calculated in the blog post, the range of 6,000 - 8,000 barrels corresponds to 250,000-330,000 gallons of fuel does not compare well (Really?) with the respective volumes 865,000 and 843,000 gallons of oil.


With all of the oil being dumped and not necessarily reported, one cannot help but wonder where are all of the regulators at?


Are they being paid off by the energy companies to remain silent of overlook disasters?


Have we as a nation reach a point with 2.4 million miles of oi pipelines throughout the U.S. at which regulation becomes impossible?


Do we have enough regulators to handle the job needed to maintain safe oil pipelines?


These questions remain unanswered.  In the United States this coming Tuesday, a national election is going to take place.  If the answer lies anywhere, the answer that involves change will be held with a future President of the United States.  In the next section, each candidates views on regulation, climate change, and business relations will be presented.


Regulation Is Needed!


As I just mentioned, a national election is going to take place this Tuesday.  If an answer to the above questions is possible, the next President should be able to shed light on the matter based on the platform on which they are running for office.  I wrote a blog a couple of days ago which just listed 20 questions that Presidential candidates should answer.  These questions are important in providing any guidance as to the next four years of funding and support for reform and regulation will look like.  See the previous post for all of the 20 questions - only those pertaining to the subject of the post will be displayed below.


The questions and answers below were directly taken (cut and pasted) from the nonprofit's "Science Debate" website under "20 Questions" for candidates about science issues.  Over 56 organizations signed on to make these questions which represent 12 million scientist around the country.


Without further ado, here are the questions and answers:


Climate Change:


Question 3:


The Earth’s climate is changing and political discussion has become divided over both the science and the best response. What are your views on climate change, and how would your administration act on those views?


Answers:


Hillary Clinton:


When it comes to climate change, the science is crystal clear. Climate change is an urgent threat and a defining challenge of our time and its impacts are already being felt at home and around the world. That’s why as President, I will work both domestically and internationally to ensure that we build on recent progress and continue to slash greenhouse gas pollution over the coming years as the science clearly tells us we must. 
I will set three goals that we will achieve within ten years of taking office and which will make America the clean energy superpower of the 21st century: 
1) Generate half of our electricity from clean sources, with half a billion solar panels installed by the end of my first term. 
2) Cut energy waste in American homes, schools, hospitals and offices by a third and make American manufacturing the cleanest and most efficient in the world. 
3) Reduce American oil consumption by a third through cleaner fuels and more efficient cars, boilers, ships, and trucks. 
To get there, my administration will implement and build on the range of pollution and efficiency standards and clean energy tax incentives that have made the United States a global leader in the battle against climate change. These standards are also essential for protecting the health of our children, saving American households and businesses billions of dollars in energy costs, and creating thousands of good paying jobs. 

These standards set the floor, not the ceiling. As President, I will launch a $60 billion Clean Energy Challenge to partner with those states, cities, and rural communities across the country that are ready to take the lead on clean energy and energy efficiency, giving them the flexibility, tools and resources they need to succeed. 


Donald Trump:


There is still much that needs to be investigated in the field of “climate change.”  Perhaps the best use of our limited financial resources should be in dealing with making sure that every person in the world has clean water.  Perhaps we should focus on eliminating lingering diseases around the world like malaria.  Perhaps we should focus on efforts to increase food production to keep pace with an ever-growing world population.  Perhaps we should be focused on developing energy sources and power production that alleviates the need for dependence on fossil fuels.  We must decide on how best to proceed so that we can make lives better, safer and more prosperous.


Energy:


Question 7:


Strategic management of the US energy portfolio can have powerful economic, environmental, and foreign policy impacts. How do you see the energy landscape evolving over the next 4 to 8 years, and, as President, what will your energy strategy be?


Answers:


Hillary Clinton:


The next decade is not only critical to meeting the climate challenge, but offers a tremendous opportunity to ensure America becomes a 21st century clean energy superpower. I reject the notion that we as a country are forced to choose between our economy, our environment, and our security. The truth is that with a smart energy policy we can advance all three simultaneously. I will set the following bold, national goals – and get to work on Day 1, implementing my plan to achieve them within ten years of taking office: 
1) Generate half of our electricity from clean sources, with half a billion solar panels installed by the end of my first term. 
2) Cut energy waste in American homes, schools, hospitals and offices by a third and make American manufacturing the cleanest and most efficient in the world. 
3) Reduce American oil consumption by a third through cleaner fuels and more efficient cars, boilers, ships, and trucks. 
My plan will deliver on the pledge President Obama made at the Paris climate conference—without relying on climate deniers in Congress to pass new legislation. This includes: 
1) Defending, implementing, and extending smart pollution and efficiency standards, including the Clean Power Plan and standards for cars, trucks, and appliances that are already helping clean our air, save families money, and fight climate change. 
2) Launching a $60 billion Clean Energy Challenge to partner with states, cities, and rural communities to cut carbon pollution and expand clean energy, including for low-income families.  
3) Investing in clean energy infrastructure, innovation, manufacturing and workforce development to make the U.S. economy more competitive and create good-paying jobs and careers. 
4) Ensuring the fossil fuel production taking place today is safe and responsible and that areas too sensitive for energy production are taken off the table. 
5) Reforming leasing and expand clean energy production on public lands and waters tenfold within a decade. 
6) Cutting the billions of wasteful tax subsidies oil and gas companies have enjoyed for too long and invest in clean energy. 
7) Cutting methane emissions across the economy and put in place strong standards for reducing leaks from both new and existing sources. 
8) Revitalizing coal communities by supporting locally driven priorities and make them an engine of U.S. economic growth in the 21st century, as they have been for generations. 


Donald Trump:


It should be the goal of the American people and their government to achieve energy independence as soon as possible.  Energy independence means exploring and developing every possible energy source including wind, solar, nuclear and bio-fuels.  A thriving market system will allow consumers to determine the best sources of energy for future consumption.  Further, with the United States, Canada and Mexico as the key energy producers in the world, we will live in a safer, more productive and more prosperous world.


Water:


Question 10:


The long-term security of fresh water supplies is threatened by a dizzying array of aging infrastructure, aquifer depletion, pollution, and climate variability. Some American communities have lost access to water, affecting their viability and destroying home values.  If you are elected, what steps will you take to ensure access to clean water for all Americans?


Answers:


Hillary Clinton:


Chronic underinvestment in our nation’s drinking and wastewater systems has sickened and endangered Americans from Flint, Michigan, to Ohio and West Virginia. Outdated and inadequate wastewater systems discharge more than 900 billion gallons of untreated sewage a year, posing health risks to humans and wildlife life, disrupting ecosystems, and disproportionately impacting communities of color. In addition, many struggling communities around the United States have limited or no access to clean, safe water.

We will invest in infrastructure and work with states, municipalities, and the private sector to bring our water systems into the 21st century and provide all Americans access to clean, safe drinking water.

Climate change is also triggering changes in weather patterns, including the increased prevalence of long, hard droughts that pose a dire risk to the health and prosperity of American communities, particularly in the West. The federal government must become a better partner in supporting state and locally-led efforts to improve water security. To that end, we will create a coordinated, multi-agency Western Water Partnership to help fund water efficiency, consideration, and infrastructure modernization projects across the region, including significant new investments in water reuse and reclamation. 

We will also work to bring cutting edge efficiency, treatment and reuse solutions to our nation’s water challenges by establishing a new Water Innovation Lab. The Lab will bring urban water managers, farmers and tribes together with engineers, entrepreneurs, conservationists and other stakeholders to develop practical and usable technologies and strategies that can be deployed by local water utilities, agricultural and industrial water users, and environmental restoration projects across the country.


Donald Trump:


This may be the most important issue we face as a nation for the next generation.  Therefore, we must make the investment in our fresh water infrastructure to ensure access to affordable fresh water solutions for everyone.  We must explore all options to include making desalinization more affordable and working to build the distribution infrastructure to bring this scarce resource to where it is needed for our citizens and those who produce the food of the world.  This must be a top priority for my administration.


Nuclear Power:


Question 11:


Nuclear power can meet electricity demand without producing greenhouse gases, but it raises national security and environmental concerns. What is your plan for the use, expansion, or phasing out of nuclear power, and what steps will you take to monitor, manage and secure nuclear materials over their life cycle?


Answers:


Hillary Clinton:


Meeting the climate challenge is too important to limit the tools available in this fight. Nuclear power – which accounts for more than 60 percent of our zero carbon power generation today – is one of those tools. I will work to ensure that the climate benefits of our existing nuclear power plants that are safe to operate are appropriately valued and increase investment in the research, development and deployment of advanced nuclear power. At the same time, we must continue to invest in the security of our nuclear materials at home, and improve coordination between federal, state, and local authorities. We must also seek to reduce the amount of nuclear material worldwide – working with other countries so minimize the use of weapons-grade material for civil nuclear programs.


Donald Trump:


Nuclear power is a valuable source of energy and should be part of an all-the-above program for providing power for America long into the future.  We can make nuclear power safer, and its outputs are extraordinary given the investment we should make.  Nuclear power must be an integral part of energy independence for America.


Global Challenges:


Question 13:


We now live in a global economy with a large and growing human population. These factors create economic, public health, and environmental challenges that do not respect national borders. How would your administration balance national interests with global cooperation when tackling threats made clear by science, such as pandemic diseases and climate change, that cross national borders?


Answers:


Hillary Clinton:


Many of the greatest - and hardest - challenges facing our country extend beyond our borders and can only be ultimately addressed through global solutions. Climate change is a case in point. And that is why as Secretary of State I elevated the role of climate policy in our diplomacy, appointing our country’s first Special Envoy for Climate Change, making climate policy a key part of our broader relationship with China and other key countries, and helping to create and launch the global Climate and Clean Air Coalition to reduce potent non-carbon climate pollution.

As the world’s biggest and most powerful economy—and as the second-biggest emitter of greenhouse gases and the biggest historical emitter—the United States has a responsibility to lead the global response to the climate challenge. By making strong progress to reduce greenhouse gas emissions at home, President Obama was able to persuade and pressure other major emitters, including China and India, to step up. This dual process, where domestic policy changes helped spur international action, led tot the historic 195-nation Paris climate agreement, the first in our history where every country agreed to be part of the solution to climate change. 

The Paris agreement is critical, but it is not sufficient on its own. To keep global warming below the two degrees Celsius threshold and avoid the worst consequences of climate change, we need to cut emissions by at least 80 percent below 2005 levels by mid-century. To get there, we will need to continually work to improve upon the goals set in Paris, both in the United States and around the world. That’s why we must work to support more clean energy investment in emerging economies, help developing nations build resilience to the climate impacts that can’t be avoided, and continue to drive clean energy innovation here at home. And we will continue to work on a bilateral and multilateral basis with our partners, with key countries like China, and with the UNFCCC to protect our nation, our planet, and our children’s future. 

When dealing with the outbreak of diseases, we must be sure to act with caution, and rely on science to inform our decisions around trade, travel, and treatment. We are privileged to live in a country that individuals around the world aspire to visit and even immigrate to. It is within our national interest to think beyond our borders, and through our leadership, do everything we can to foster peace, health, and security around the world. In the United States, we need to break the cycle in which our own public health system is beholden to emergency appropriations for specific epidemics. We can do this by creating a dedicated Rapid Response Fund to help shore up our defenses, accelerate development of vaccines and new treatments, and respond more effectively to crises. We will also create a comprehensive global health strategy that moves beyond the disease-by-disease emergency model and seeks to build a robust, resilient global health system capable of quickly responding to and ending pandemics. 


Donald Trump:


Our best input to helping with global issues is to make sure that the United States is on the proper trajectory economically.  For the past decade we have seen Gross Domestic Product growth that has not provided adequate resources to fix our infrastructure, recapitalize our military, invest in our education system or secure energy independence.   We cannot take our place as world leader if we are not healthy enough to take care of ourselves.  This means we must make sure that we achieve our goals in tax reform, trade reform, immigration reform and energy independence.  A prosperous America is a much better partner in tackling global problems that affect this nation achieving its national objectives. 


Regulation:


Question 14:


Science is essential to many of the laws and policies that keep Americans safe and secure. How would science inform your administration's decisions to add, modify, or remove federal regulations, and how would you encourage a thriving business sector while protecting Americans vulnerable to public health and environmental threats?


Answers:


Hillary Clinton:


It is essential that environmental, health, and energy regulations, among other areas, use the best available science to guide decision-making, and I am committed to making sure that continues. For instance, we will have science guide us as we make important investments around health care. We will continue to invest in research to further our understanding of disease, including ramping up our investment in Alzheimer’s and related dementias to $2 billion per year, continuing Vice President Biden’s Cancer Moonshot, and scaling up our broader investment in the National Institutes of Health’s budget to combat all of the diseases of our day. 

My opponent in this race has consistently discounted scientific findings, from his comments about vaccines to his claim that climate change is a hoax. These dangerous positions not only put Americans at risk, but can have long term impacts on our country’s growth and productivity. Science will ensure our country continues to progress, and will help our government use its resources to provide the best possible life for all Americans.  


Donald Trump:


This is about balance.  We must balance a thriving economy with conserving our resources and protecting our citizens from threats.  Science will inform our decisions on what regulations to keep, rescind or add. A vibrant, robust free market system will regulate the private sector.


The above responses give us a starting point on which to form our opinion when we head to the voting polls next Tuesday.  At this point, you might ask the following question:


Mike, there are more than two Presidential Candidates?


What about Gary Johnson or Dr. Jill Stein?


For brevity, I chose to only include the two major candidates responses.  In order to view the remaining two candidates answers to the above questions, please visit my previous blog post with the questions and answers.


Conclusion


Regardless of who wins next Tuesday at the national election for the next seat as President of the United States, the issues at hand will still remain the same.  Although, armed with the answers to the questions above along with the remaining questions, each of us can get a sense of where the support lies in protecting us and the environment.  Our transition toward renewable energy is not just a "must happen" but a "when will it happen" statement.  With a more educated voting population, the process can move forward more easily.  Each of us should consider the above questions and answers seriously and plan for the future.


Until next time, Have a wonderful day!


Tuesday, November 1, 2016

What Technology Is Being Installed By 'Energy Transfer' To Prevent An Oil Spill?

At first sight, the following picture of a tweet from the website 'Twitter' might be confusing:


Although, across the nation over the past few years, 'Big Oil' companies have had the opportunity to conduct business as usual without a word (in the news) or penalty of recent 'oil spills'.  In light of this, the question remains over the current feud across the Dakota Pipeline:


What measures (technological advancements) are being installed to prevent another oil spill?


The company mentioned in the above article (Tweet) is named 'Energy Transfer' - an oil company out of texas whose roots are in the oil pipeline business.  The above question is a fair question.  Especially, if we look further at the amount of oil that will be moving across the pipeline per day.  Readers of this blog site are used to dealing with the dimensional analysis of large volume oil (and here) and large volume gas spills.


In the paragraphs below (a brief), dimensional analysis is performed to illustrate the potential liability and environmental danger posed by such a massive project.  After reading this, you should have a better grasp as to the reason why technology should be used and required to be installed to ensure no oil spills occur in the pipeline.


How Much Oil Is Moved Per Day?


In a recent article in 'The New York Times' titled "North Dakota Oil Pipeline
Battle: Who’s Fighting and Why"
 the opposition toward the pipeline was discussed briefly.  A few points were made by either side.  Here is a video - from the article illustrating the cohesive opposition toward such a project:


As you can see, the project has spurred cohesion among indian nations that might otherwise have not banned together in opposition toward the future pipeline.  Given that their interests are shared, the cohesion is expected.  In order to understand the dangers at hand with the construction of the pipeline, we must explore the amount of oil that will be moved across the region on a daily basis.  Here is an excerpt from the article regarding the flow rate:


The Dakota Access pipeline is a $3.7 billion project that would carry 470,000 barrels of oil a day from the oil fields of western North Dakota to Illinois, where it would be linked with other pipelines. Energy Transfer says the pipeline will pump millions of dollars into local economies and create 8,000 to 12,000 construction jobs — though far fewer permanent jobs to maintain and monitor the pipeline.


At first sight, the amount of jobs created seems worthy of the project.  Further, the dangers posed by transporting the oil by truck were also highlighted to motivate the use of the pipeline as shown below:


 Energy companies and their federal overseer, the Pipeline and Hazardous Materials Safety Administration, promote the safety record of pipelines. Pipeline companies say it is far safer to move oil and natural gas in an underground pipe than in rail cars or trucks, which can crash and create huge fires.


Yes, the above might be true if the incidents of trucks hauling oil were that frequent.  Further, a truck typically carries around a few thousand gallons of oil.  This begs the question regarding the pipeline:


How much oil (in gallons) will be transferred per day across the region?


In order to answer the question, we need to convert the amount of oil contained in a single barrel to units of gallons.  According to Google, there are 42 gallons of oil per barrel of oil.  In an equality, the statement can be viewed in the following expression:


Taking the conversion factor of 42 gallons of oil per barrel of oil along with the volume stated in 'The New York Times' article of 470,000 barrels of oil per day, the following conversion can be carried out below:


Wow!  This highlights one of my major problems with the news media.  Too often, the preferred units of oil are 'barrels' -- which prevents a true grasp of the actual scale.  Why?  When I see the number  470,000-barrels, I find the calculation difficult to carry out in my head immediately = 470,000 barrels x 42 gallons/day????  See what I mean?


If I am having trouble, then the average person who has an aversion toward math does not even try.  Therefore, the value of the reported statistic gets lost in the news report.


What Is The Problem With A Pipeline?


In the same article above, the motivation to move oil down a pipeline (and construction) was due to the 'inherent' problem or danger with hauling oil in a truck.  A typical tanker truck which transports fuel is shown below:


Source: John Hewat from Canberra Australia


The capacity of both tracker and trailer is a whopping 6,000-gallons.  Each tank holds an average of 3,000-gallons.  In the excerpt above, the danger of a spill associated with transfer in a truck was mentioned.


As a reader, should we believe the excerpt?


How can we verify the inherent danger of hauling oil in a truck?


How about a calculation?


If the above volume being transferred per day of 470,000 - barrels of oil or as calculated 19.7 million gallons is considered for dimensional analysis, the above questions can be answered.  In order to compare the relative dangers of transporting oil by truck or in a pipeline, the rate of flow needs to be expressed in units that are within reach.


The number of 19.7 million is meaningless to compare to a potential truck spill on the highway.  Why?  Because, the value is expressed per day.  If a truck can carry a total load of 6,000 gallons over a given distance in a given amount of time, then the relative times should be the same.  What do I mean by this?  In the unfortunate event of a spill (say an overturned truck) with 6,000-gallons, the typical clean up time would be on the order of hours.  Maybe even a day.


In the event of a day, the following statement could be made about comparing a truck full of oil (6,000 gallons) to a break in an oil pipeline.  The total damage (in terms of volume) spilled by the truck would be 6,000 gallons.  In the case of the oil pipeline, if the spill occurred over a day, then the total would be 19.7 million gallons?  Wow.  Obvious in this comparison, the safety would be with transporting the oil by truck.


How about a train?


Each tanker rail car like the one shown below holds around 30,000-gallons:


How much oil would be spilled per hour in the pipeline case?


To answer the question, the following calculation is carried out to switch units from "gallon/day" to "gallon/hour" is illustrated below:


Over the course of 1 hour, a break in the pipeline could result in the maximum amount of 820,000-gallons/hour.  Oh My!  Still no comparison to either a train tanker or a truck tanker?  Right?


In the article mentioned above from 'The New York Times' the following evidence of recent failures of various pipelines were given.  Here is an excerpt below:


But pipeline spills and ruptures occur regularly. Sometimes the leaks are small, and sometimes they are catastrophic gushers. In 2013, a Tesoro Logistics pipeline in North Dakota broke open and spilled 865,000 gallons of oil onto a farm. In 2010, an Enbridge Energy pipeline dumped more than 843,000 gallons of oil into the Kalamazoo River in Michigan, resulting in a cleanup that lasted years and cost more than a billion dollars, according to Inside Climate News.


As you can see, the volumes that are mentioned in a typical oil spill associated with pipelines result in 'hundreds of thousands' of gallons.  Not in the 'tens of thousands' like what are transported with either a truck tanker (6,000 gallons) or a railcar - oil tanker (30,000 gallons).


What New Technology Can Be Installed On Pipelines?


Why have regulators refused to come down hard on companies when oil or gas spills occur?  Specifically, when a spill occurs, regulators jump up and catch the spotlight on TV along with politicians pointing fingers and promise the american people that "tough protocols" are in store for these perpetrators.  Does any real change occur though?


It would seem that with the drop in cost of technology (sensor technology) that these large companies could stick a sensor on many points along the pipeline to measure leaks or breaks.  Couple this to installing various valves at more points to prevent large volumes of oil or gas to spill at any one point.  Instead, we just see the same stories appearing with values reported in the 'hundreds of thousands' of gallons spilled with no real surprise.


In any of this reporting, there is never any real accurate account of the actual spill or the total cost of such a spill on the environment and economy.  I know -- the answer is complicated.  Although, the longer the answer takes to figure out, the more of our environment will be damaged by future spills.  Lets hope regulators come on strong next oil spill and actually regulate to prevent future spills.


There is no wonder in my mind why these indian nations are protesting.  Would you want a giant oil pipeline running over your water?  Especially, after hearing about the various spills recently.  Something has to be done.  Change needs to start now.  Change is happening now with the education from this blog post.  Go make a difference and be concerned about environmental damage around your house.


Until next time, have a great day!


Sunday, October 9, 2016

How Much Rain Did The East Coast Receive From Hurricane Matthew?

News reports are surfacing everywhere on Twitter (and other social media outlets) discussing the devastation that Hurricane Matthew has brought to the East Coast.  Below is one example from the news site 'NBC News':


The devastation is without question.  What is questionable is the preparation of emergency agencies based on knowledge a few days (weeks) earlier with the disaster that unfolded in Haiti.  Haiti received an enormous amount rain -- which I wrote a blog about last week.  The amount of rain was so large that the summer storm in China which received a whopping 580 billion cubic feet was eclipsed by 750 cubic feet of rain.


Using the same approximations (land area, average rainfall, etc.), lets calculate the amount of rain that the East Coast has received to get a better grasp on the terrible Hurricane Matthew that has ripped apart and drenched parts of the world.


East Coast Receives Rain


As if the devastation to Haiti was not enough to contend with.  But Hurricane Matthew continued to drive up into the United States.  Various news accounts have given numbers which allow us to approximate and estimate through dimensional analysis the terrible amount of rain that have plagued regions.


To accurately assess the total volume of rain that has dropped on the entire East Coast as a result of Hurricane Matthew, each of the weather stations would have to report an average amount of rainfall across their respective region.  Not every region has the capability or funding to do so unfortunately.  Therefore, we have to rely and approximate based on whatever values are reported.  Hopefully, in the future, this disparity will change and weather prediction and storm forecasting will benefit to a large extent from such positive change.   The example I will use below is of the tremendous amount of rainfall that has hit the state of North Carolina in the last few days.


According to the news site 'NBC News' in an article titled "U.S. Death Toll From Hurricane Matthew Rises to 17 Across Four States" reports were given of amounts of rain (listed in inches) fall to various regions:


By Saturday night, rainfall totals were 16 inches in Bladen County, 15 inches in Goldsboro, 12 inches in Lumberton and Smithfield, and 9 inches in Raleigh and Rocky Mount, McCrory said in a statement.


After reading the above statement regarding the amount of rain that fell on various counties in North Carolina, you might not be shocked.  Picture says thousands of words.  Remember that rain was not the only component that made up the devastating impact of Hurricane Matthew.  The other destructive component was the wind factor with speeds reaching into a hundred miles per hour in some places.


Compounding the destruction from rainfall alone, the wind can add to the destruction by imposing a force to be reckoned with.  Below is a video (just over a minute) from 'YouTube' to illustrate my point:


Watching the video above really drives home the destructive power of wind.  Too often, people watching the storm from a television cannot comprehend the effect of wind in a given storm.  Although, after rain has fallen or in combination with, wind can have very devastating and destructive effects on a given geographic area.  Especially, if the area is not built to receive that much rain.  This was the case with a storm in Elliot City (Maryland) earlier this year.


In order to understand the extent of the damage, a few calculations can be performed.  As I mentioned above, we can use the logic and approximations that we have assumed in earlier posts on this site.  First, we can find out the geographic area by looking in the 'Wikipedia' sites for the counties and regions listed in the excerpt above.  Using the same methodology as in previous blog posts of calculating a volume from the product of the area (geographic land mass area) and the height (of rain fall), a total volume will result from our efforts using the expression below:


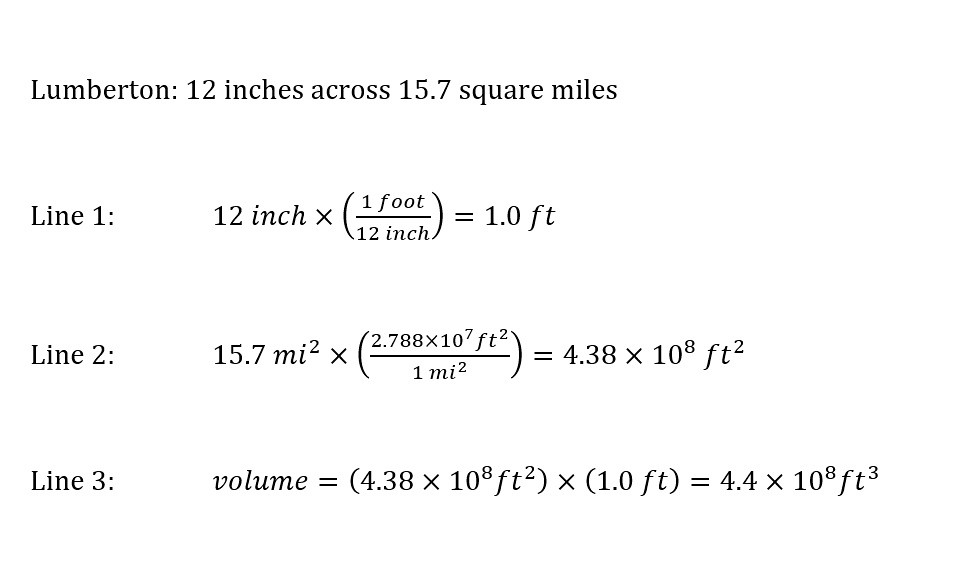
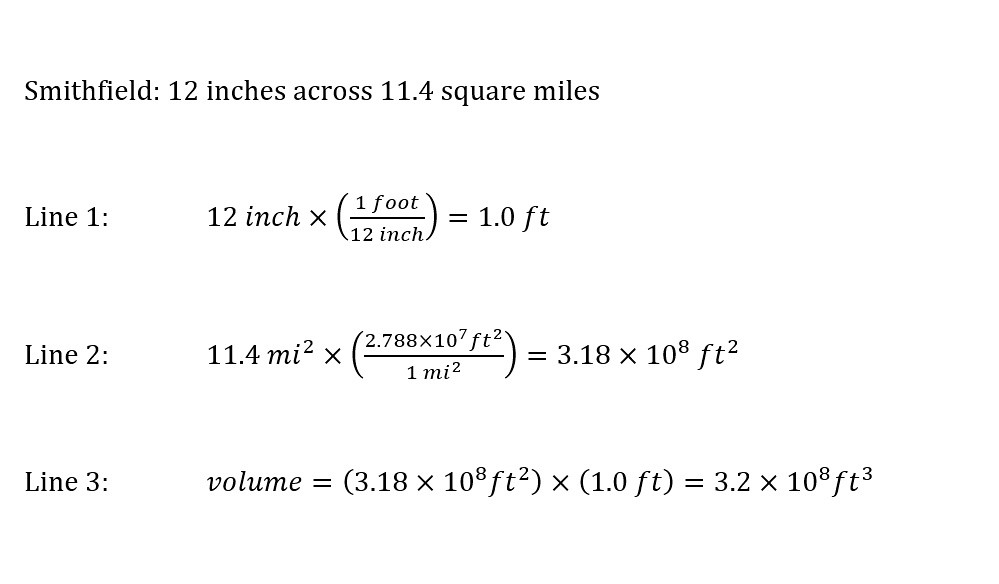
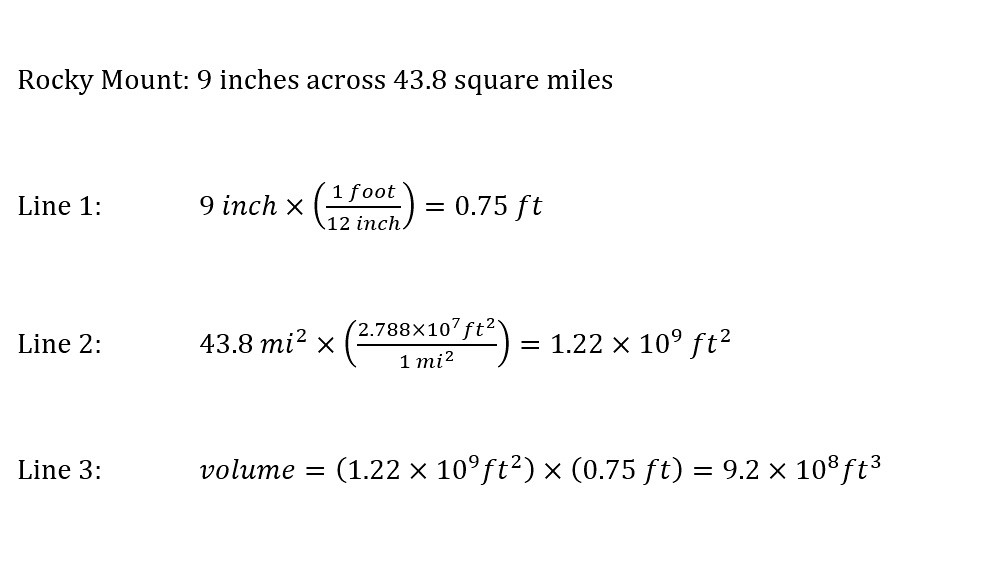
I will list the area (in square miles) and height (in inches of rainfall).  After performing the conversion of square miles to square feet along with converting inches into feet, a final calculation can be performed. We can plug the values directly into the expression to obtain a volume.


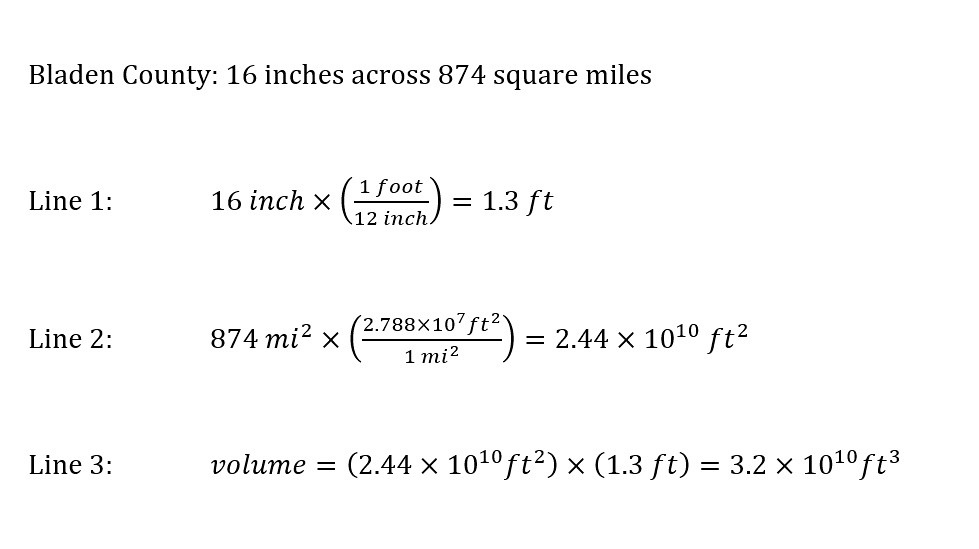
Six regions were listed in the excerpt above: Bladen County (874 square miles), Goldsboro (24.8 square miles), Lumberton (15.7 square miles), Smithfield (11.4 square miles), Raleigh (142.8 square miles), and Rocky Mount (43.8 square miles).  It is important to note that each of these regions have a water component that was not included in the geographical area calculation.  This would increase the area of each region.  Additionally, the water component exacerbates the effects of a Hurricane like Hurricane Matthews.


Again, the outline of the calculations below will be as follows:


1) Line 1: Conversion of units of rainfall - from inches to feet.


2) Line 2: Conversion of units of land area - from square miles to square feet.


3) Line 3: Volume of rainfall - land Area multiplied by Height of rainfall.


With the values and order of calculations/conversions listed above, we can now calculate a volume for each region as shown below:


The volumes listed above are enormous in magnitude which are based on the reporting of the devastating effect of Hurricane Matthew in North Carolina.  As I mentioned above, the state of North Carolina has waterways dispersed throughout the state as illustrated below from 'Wikipedia':


Source: Alexrk2


The East Coast has received an amount of rain that has so far claimed the lives of 18 people (in North Carolina).  Understanding the magnitude of such disasters gives the reader an idea of the force of destruction that such disasters bring with them.  The news cycle is short compared with the long-term recovery process of natural disasters.  The need for accurate reporting and transparency is critical to convey the need for greater infrastructure for future disasters.  Disaster preparation is achieved through transparency and education.


Just in the last six months, the world has seen rainfall that is beyond comprehension in various areas of the US and beyond.  In the paragraphs below, I decided to illustrate the natural disasters in a different light.  The metric I have chosen is appropriate to some degree to illustrate the large volume of rain that has so far fallen on the East Coast.


How Many 'World Largest Pools' Could Be Filled?


The values reported above are enormous.  Well into the billions of cubic feet of rain have dropped onto North Carolina.  If the volume of rain that has dropped onto the six regions is accurately representative of the total rainfall that has dropped onto the entire East Coast, then the total amount is just simply incomprehensible -- to say the least.


When such enormous amounts of volumes are encountered, an appropriate metric is the "World's Largest Pool."  This giant structure has been used frequently on this site -- starting with the first time last year.  Two pictures are shown below for a reference from the website 'Huffington Post':


And ...


Source: Huffington Post


The total volume of this mega structure that has the title of the "World's Largest Pool" is a whopping 60 million gallons.  Yes, you read correctly.  In the image above, a sail boat is shown in the middle.  Alternatively, there are hotel structures in the first image to give a reference to the size of amazing feat.


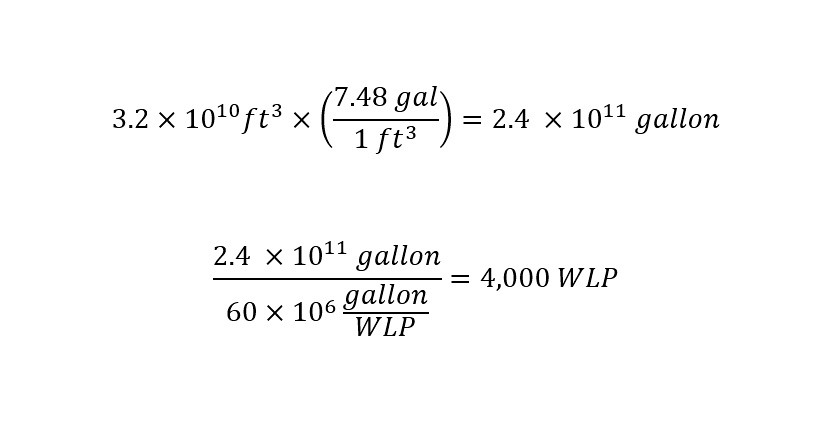
If we wanted to calculate the amount of rain in each region mentioned above in North Carolina during Hurricane Matthew, we could easily.  First, each volume would have to be converted from cubic feet to gallons.  The conversion would allow us to directly compare each volume as an integer value.  That is the ratio would be expressed as an integer value of the "World's Largest Pool."  From here on out, the "World's Largest Pool" will be abbreviated to "WLP".


Without further ado, lets figure out how many of the WLP could be filled with the respective volumes of rain.  One example calculation will be shown for the region of Bladen County in North Carolina.  All other volumes will be displayed in a table after.


Just when you think that the numbers cannot get any larger, casting the values in different units (in this case US gallons) does just that.  Furthermore, as the result suggests, the amount of rain that fell onto Bladen County is enough water to fill 4,000 of the "World's Largest Swimming Pool".  WOW.


Using the "World's Largest Pool" or WLP as a metric really changes the volume of water.  Before the calculation, all that we were left with from the calculations in the first section were enormous amounts of rainfall expressed in units of cubic feet.  With the calculation above, one can easily view the pictures of the WLP and try to make sense of the number.  Furthermore, if that amount of water fell on any geographical region, there would be damage.


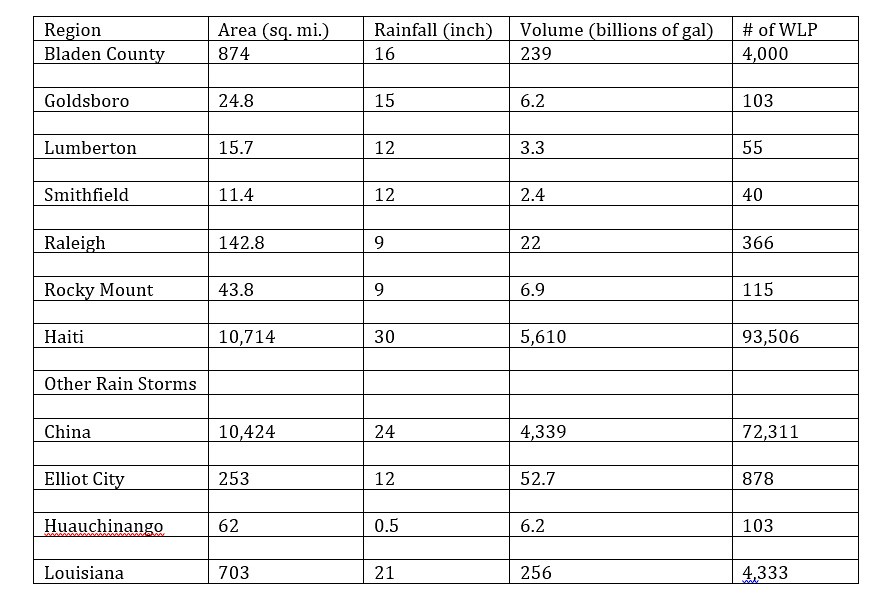
As I promised above, I would provide a table with the equivalent information as calculated above for other recent storms.  Think about the following storms which have been covered on this blog site: China, Elliot City (Maryland, USA), Huauchinango (Mexico), Louisiana (USA), and Haiti.


Here is the table with the values as promised above for comparison:


The importance of showing all of the data on the storms is to illustrate the damage caused by different amounts of rain.  Each storm is different.  Which is why the  continual update of weather models needs to be sought after.  Similarly, more money needs to be devoted toward improving storm calculation programs.  Additionally, more technology (sensors, stations, drones, etc.) need to be deployed to pick up data and feed the data back into the models to improve accuracy.


The tragedy caused by the storms this year so far are enormous and incomprehensible.


How do we move forward as a Nation?  


As a World?  


What about Climate Change?  


Are these linked in some manner?


These questions remain open ended along with others.  Although, as long as we move forward as a world thirsty for knowledge and thoughtful/mindful about the magnitude of such disasters, change can proceed in the correct direction.  Too often each of us proceed throughout our day with large amounts of stress and anxiety.  We do this without considering another force, the force of nature.  The force of nature can compound our stress and anxiety by hundreds of orders of magnitude.  Think of those put out of their homes by the storms recently as you stress at work.  Take a minute to think of those without power or water or a house.  Have a great day!


Tuesday, October 4, 2016

How Much Rain Did Haiti Really Receive?

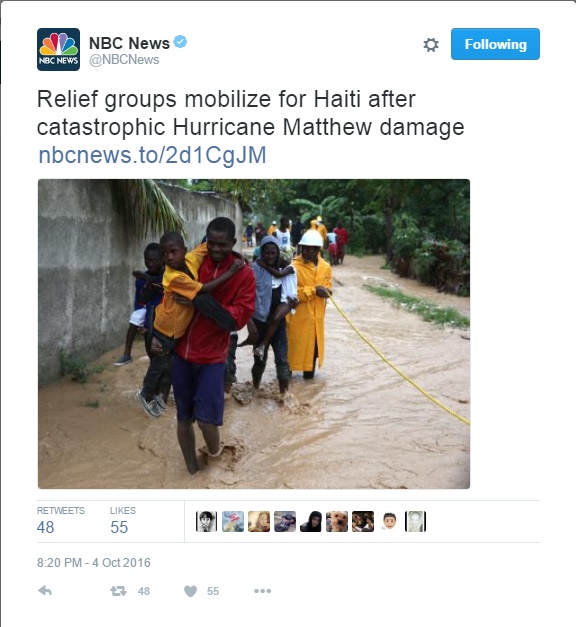
Tonight, as I was writing the blog I just finished on autonomous cars, I was scrolling through Twitter to find the original post and ran across the following tweet shown below:


Immediately, I clicked on the article to find out that Haiti received a significant amount of rain from Hurricane Matthew.  How much in comparison to other torrential rain storms this year?  Read onto find out.


How Much Rain Did Haiti Receive?


According to the news site "NBC News" which posted an article titled "Hurricane Matthew: Relief Groups Mobilize for Haiti After 'Catastrophic' Damage" an enormous amount of rain is expected to hit Haiti.  Here is an excerpt describing the magnitude of the storm:


The storm was expected to dump up to 20 inches of rain on parts of southern Haiti and southwestern Dominican Republic. Isolated areas could get up to 40 inches, the hurricane center said.


Instantly, after reading this, I stopped what I was doing and looked for an old post I wrote a few months ago on the massive torrential rain that China received.  Alright, I published the blog post that I was working on first -- in order to focus on the massive amount of rain that is expected to hit Haiti.


In order to compare the amount of rain that is expected to hit Haiti, I needed to calculate a total volume.  I will walk you through the calculations and logic in the following paragraphs.  Some of the values are approximations which I will try to clarify as we go.  If you have any questions regarding approximations or assumptions, just leave a comment.


With this in mind, first, we need to know how large (area in square miles) Haiti is in order to calculate a total volume.  According to the "Wikipedia" page, the total area of Haiti is 10,714-square miles.   The volume of rain was not reported in the news.  Although, a height was reported. According to the excerpt above, between 20 inches of rain in the Southern part of Haiti and 40 inches in other parts -- which could be approximated (grossly) to an average of 30 inches across all of Haiti.


Over the course of the next few days, news reports will refine their values and we can do a follow up comparison.  Specifically, we can then evaluate how far off our approximation was in this post.  For now, lets proceed with the calculation of the total volume of rain.


In order to calculate a volume, three numbers will need to be known.  Or in this case, two numbers will need to be obtained.  All of them have been specified already in this post.  We will need an "area" and a "height" to determine the total volume.  What's missing then?


The values are all reported in different units.  What?  Yes, we have an area of Haiti that is reported as 10,714-square miles.  Further, we have a height of rain that has or is estimated to fall to be 30 inches.  In order to compare and calculate, the units have to be uniform.  In this case, lets choose units of feet.  Our total volume will be reported in cubic feet of rain.


To convert the reported values, we will need the conversion factors from inches to feet and from square miles to square feet.  From the previous blog on rainfall in China, the value is listed below in the conversion shown below:


Next, the equation for the volume is equal to the area (geographic area) multiplied by the height of the rainfall.  The equation for volume is shown below with the above values filled in appropriately:


Wow!  What does the above result mean?


How Does The Value Compare To Other Recent Storms?


As I mentioned earlier, I wrote a blog post on the torrential rain fall in China a few months ago.  Turns out that 12 provinces received around a couple of feet of rain over a geographical area of 10,000 square miles.  Wow!  The total cubic feet of rain was 580 billion cubic feet.


According to our calculations above, the total rain fall expected to hit Haiti as a result of Hurricane Matthews is 750 billion cubic feet of rain.  That is nearly 1.3 times the amount of rain that hit China earlier this year.  These two storms are huge in comparison to the four other storms that I have wrote blogs about: Maryland (USA), Louisiana (USA), Mexico, and Macedonia.


Still, the fact that Haiti is receiving so much rain over its entire land mass is life threatening.  More so than in China, although the populations and land masses are quite different.  Nonetheless, we should be sending humanitarian aid to the victims of these terrible storms.  By calculating the amount of rain fall each storm drops on a given geographic area, the realization of the threat becomes more real.  Dimensional analysis allows us to visualize the magnitude of such disasters by comparing them to our own geographic area.


How does the geographic area of Haiti relate to the geographic area that you live in?


Think about the magnitude of this devastating event.  How would you be impacted by the same volume of rain?  Remember, the magnitudes and values reported/calculated above, neglect the wind speed of 145 miles per hour that blew across the region.  That speed of wind would produce and life threatening force that would level houses and buildings (if not properly built).


Until next time, have a good night.