Showing posts with label water resources. Show all posts

Monday, December 19, 2016

How Much Water Is 55 Billion Gallons Of Rainfall?

As the water season began (at least that is what is reported by the news) in early October of this year, news accounts will be arising discussing various rainfalls.  Certain accounts will detail the much needed rainfall while others might even scare readers of the excess rain and the damage that might follow.  Regardless, the way the news agencies reports rainfall is often misleading and uneventful.  Below, I discuss one example from the "Los Angeles Times."


How Is Rainfall Reported?


Over the course of the last year, I have started to write about the reporting of rainfall.  I am constantly amazed at the subtlety with which large volumes of rain are reported after a given storm.  This problem of mine started back near the end of 2015 -- after reading a report of a storm.


Before I get into the initial motivation to investigate news reports about volumes of rain fall, I would like to say that I am still baffled why the news reports "inches" of rainfall while total volumes in units of "cubic feet."  I would prefer the units of total rainfall reported in units of "gallons" -- personally.  The reason is that I can visualize using a few metrics (large volumes -- pools, stadiums, etc.) to compare the reported values to.  Although, one could argue that my request is just unique to me and I could just as easily perform dimensional analysis to get the units that I feel comfortable with.  Fair enough!


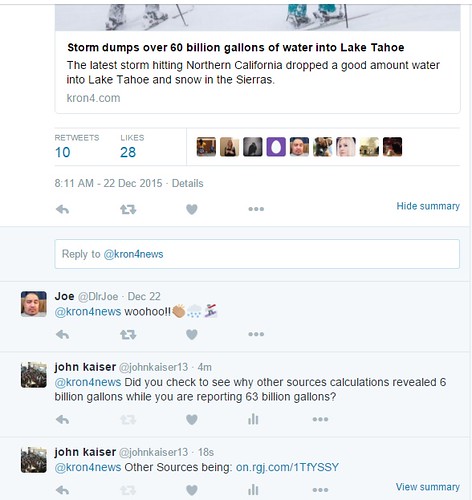
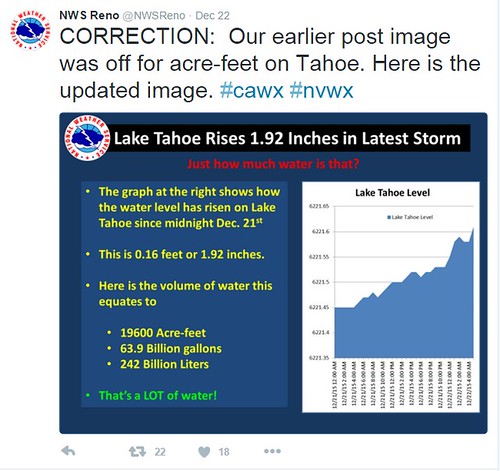
During the end of the month of December of 2015, large volumes were reported and I wrote an initial blog post about this rainfall in following month.  Accuracy was not the first and foremost during this storm -- which concerned me.  The reason why is in the numbers.  Let's take a look briefly at the reported numbers which in some cases were skewed or miscalculated.


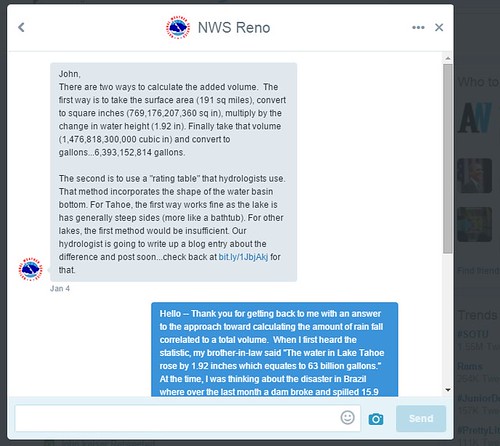
In that blog post, the news reported a number based on the weather service of 65 billion gallons of water from a single storm -- which is an enormous amount of rain.  One of my family members told me this factoid and stated that 65 billion gallons of water equated to increasing the water level of Lake Tahoe by 6 inches.  Meaning, that enormous amount of rain if collected and poured into Lake Tahoe would result in an increase of 6 inches of height to the lake.


After hearing that number, I sat back and thought -- Wow -- that means that Lake Tahoe is larger than I thought.  This factoid bothered me for a few days.  As a result, I decided to carry out a few calculations which are shown in the blog post.  I will get to the point.  The result of the calculation gave a volume that was very different than the volume reported by the news.


What was I to make of this disparity in volumes?


Did I make a mistake in my calculation?


Did my approximation not make sense?


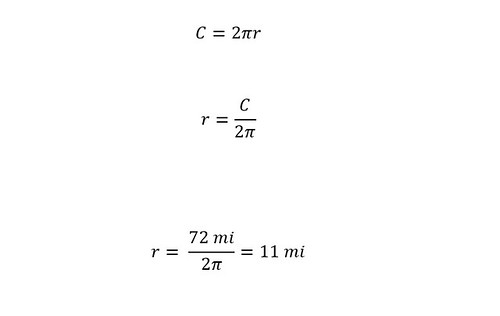
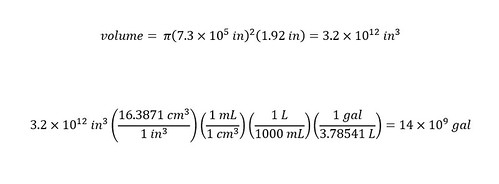
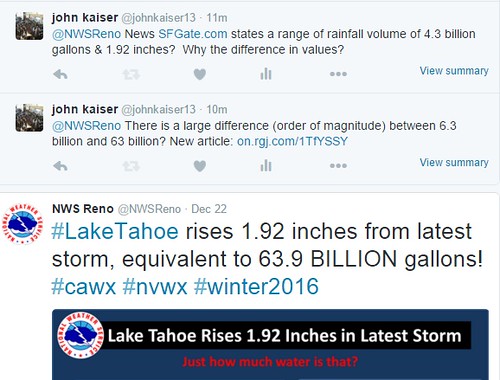
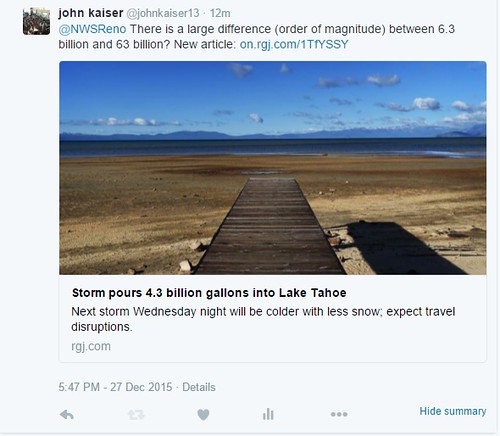
Check out the blog to understand my full thought process in calculating using a simple approximation -- that of a cylinder.  The result of the calculations revealed that the total volume of rainfall in that particular storm was 6.5 billion gallons NOT 65 billion gallons.  A factor of 10 different in the reported statistic.


Should we be concerned by the lack of accuracy in reporting?  


Yes.


Two major results came from that practice:


1) The volume I calculated was correct.


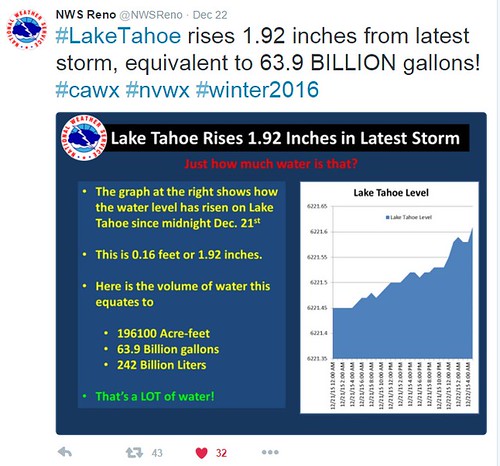
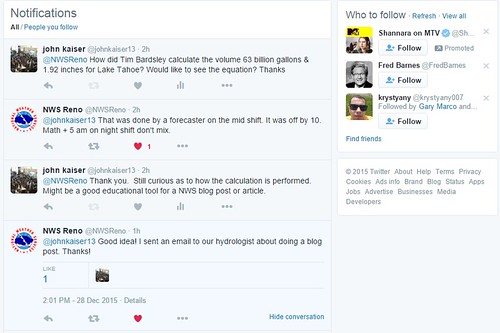
2) The weather station corrected their reported volume after checking their calculation.


3) I learned a better method by which to perform dimensional analysis of rainfall using reported volumes.


Out of this exercise came the correction of the weather station.  Again, all of this is in the blog post.  Additionally, I learned that method by which the weather stations use (one of the methods) to calculate the volume of rainfall in a given storm.


After carrying out the exercise and writing the blog, I decided that from that point on forward, I would watch news accounts of rainfall volume in the future.  Further, I would look out for reported statistics and try to put them into perspective for the reader using dimensional analysis.  The result has been the blog posts that make up this site.


The results of previous blog posts this year so far regarding the total volume of rainfall have been collected into a table shown below:


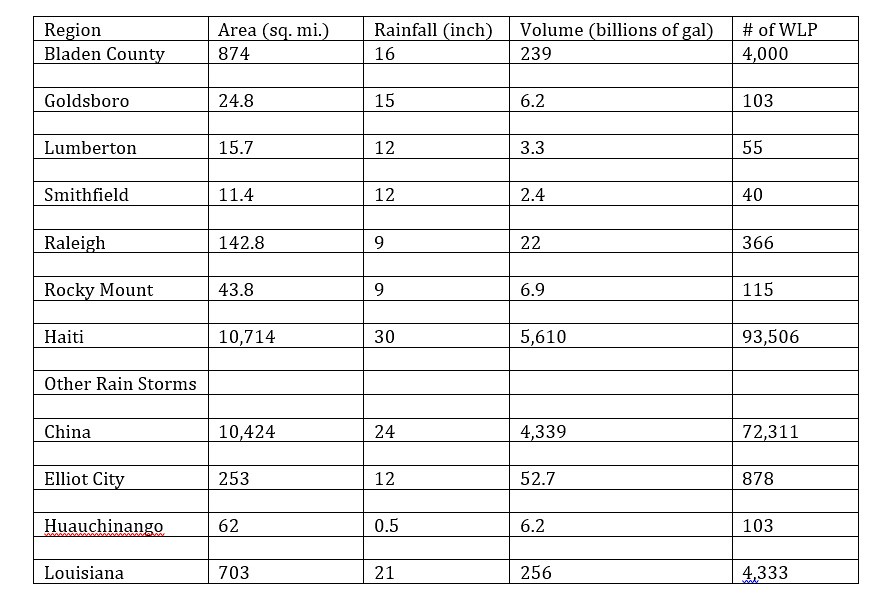
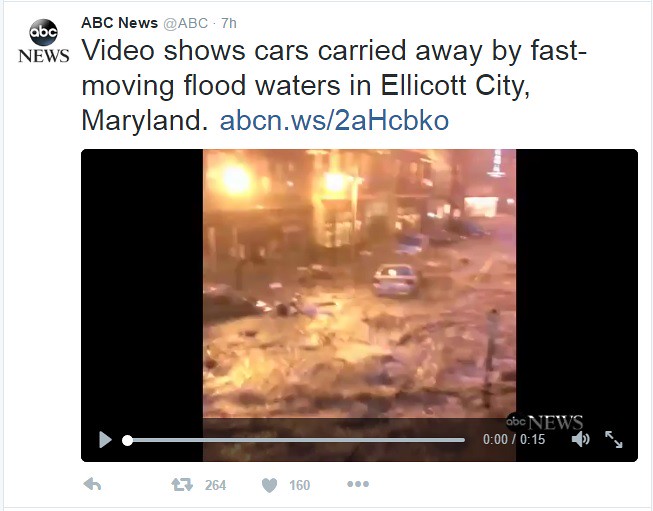
Note: Click on any of the cities to access original blog post (with calculations) on this site -- (1) Bladen County, (2) Goldsboro, (3) Lumberton, (4) Smithfield, (5) Raleigh, (6) Rocky Mount, (7) Haiti, (8) China, (9) Elliot City, (10) Huauchinango, (11) Louisiana -- and I forgot (12) Macedonia


The first seven storms listed in the notes above are a result of Hurricane Matthew which ripped through the Eastern part of the USA originating from Haiti.  The last five storms listed are storms that have occurred due to unusual rainfall this year.   Recently, the Associated Press covered this in a story about the National Oceanic and Atmospheric Administration released report on rainfall this year around the world with implications toward Climate Change.


Regardless, the enormity of the storms are worth writing about.  With that in mind, let's move onto the reported value of rainfall over the season thus far in Folsom (California) of 55 billion gallons so far.


How Much Is 55 Billion Gallons Of Rainfall?


In a recent story in the 'Los Angeles Times' titled "A tale of two droughts in California: Wetter in the north, still bone dry in the south" the disparity of rainfall between Northern and Southern California was discussed with varying numbers reported which would make a person mind spin.  One excerpt that stuck in my mind was the following regarding rainfall received in Folsom:


The recent rains were enough to force federal officials to begin releasing water from Folsom Lake to protect against flooding for the first time since March, said Louis Moore, a spokesman for the Bureau of Reclamation, which manages the reservoir. Since the beginning of December, Folsom has risen more than 20 feet — an increase of about 55 billion gallons.


Now, if you are a reader of this blog, then the number 55 billion gallons should stick out of the excerpt above along with the number 20 feet.  Further, with the previous blog posts on this site, you will understand my need to understand the magnitude of large numbers like this.  Numbers that are truly incomprehensible.  I believe that the value of 55 billion gallons of rainfall qualify for the analysis typically found on the site.


To start such an analysis to put the enormous number into perspective, a metric is needed.  A metric serves as a 'ruler' of measurement.  Metric's specifically take away all ambiguity when defined.  What?  I know that is confusing.  Basically, we need a measurement to compare the volume too.


Let's choose 3 volumes and see how the statistic of 55 billion gallons compare.  The 2 volumes will be: 1) World's largest pool  2) Lake Tahoe.


1) World's largest swimming pool:


To start an analysis of the volumes is to ensure that the 'units' of measurement are the same.  That is, for the example at hand, the volume of the World's Largest Swimming Pool needs to be expressed in units of 'gallons' to be directly compared to the volume reported above of 55 billion gallons.


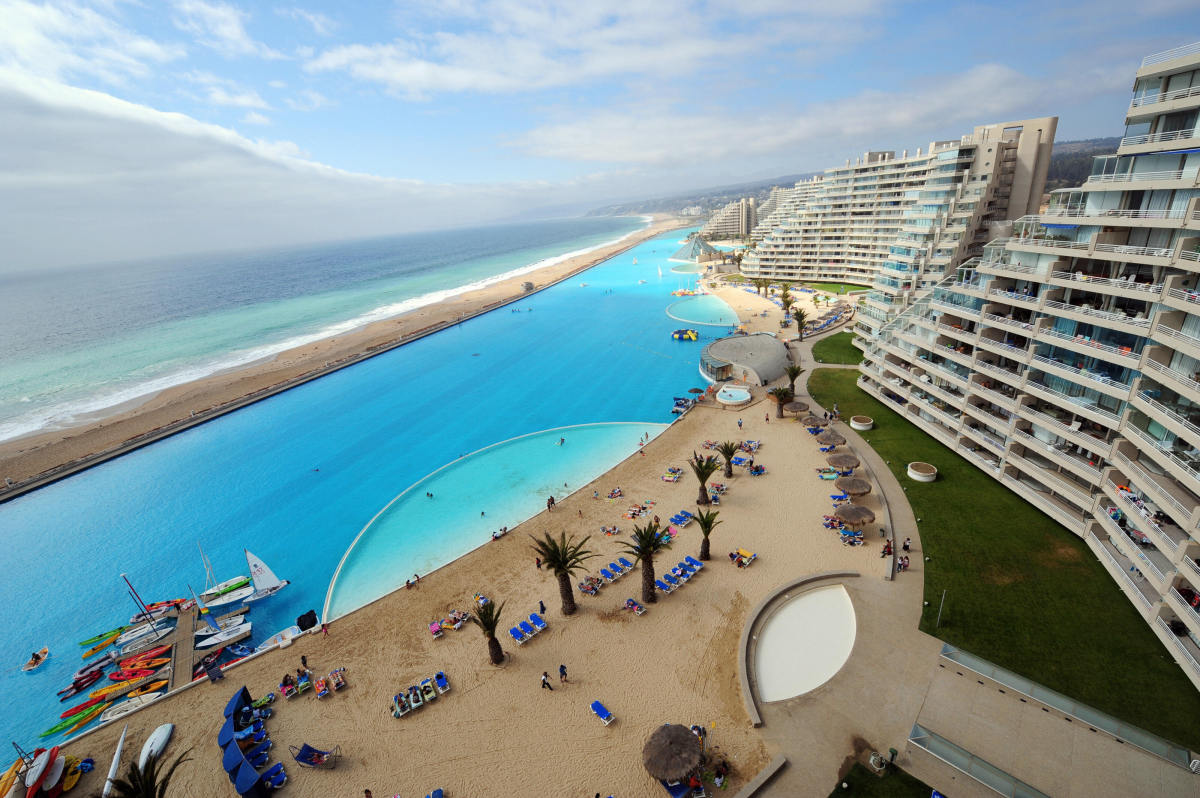
The World's Largest Swimming Pool is shown below:


Source: Twisted Sifter


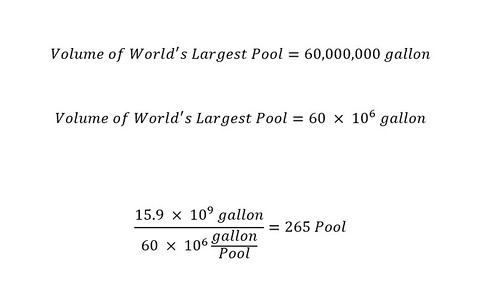
The volume of the enormous swimming pool is a whopping 66 million gallons.  That is huge.  If we express the volume of rainfall reported in the article in scientific notation, the number would look like the following shown below:


Remember, if the volume were written out in long form, the value would appear as follows: 55,000,000,000 gallons!  Expressing the number in scientific notation allows us to express the number in a compact form.  The volume of the World's Largest Pool can be expressed similarly in a compact scientific notation.


Since the units are of the volume are expressed in 'gallons' -- the number of swimming pools that could be filled with 55 billion gallons of rainfall can be directly determined by dividing the two volumes as shown below:


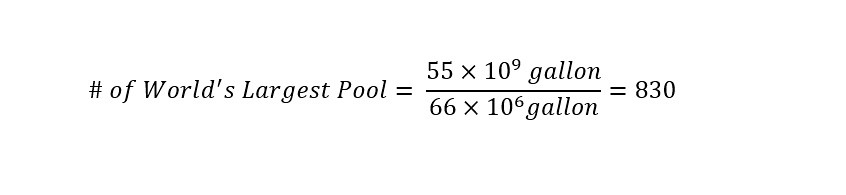
Wow!  The result can be interpreted as the following:


55 billion gallons of rainfall would fill 830 - World's Largest Swimming Pools!!!!!!!!!


How does one visualize that number of swimming pools?


Note: Since my last blog post using swimming pool in San Alfonso del Mar -- another pool built by the same company has built the new "world's largest swimming pool" -- Crystal Lagoon located in Sharm-el-SheikhEgypt.


Can you visualize a total volume of 830 of the above pools?


I cannot.  Maybe another metric is needed to better grasp the enormous volume of rainfall.


Sometimes our choice of a metric does not necessarily cast the volume in a graspable light.  For instance, trying to visualize the total volume of 830 World's Largest Pool combined is too difficult.  Maybe another analysis is useful with a larger metric to cast the volume is needed.


 In order to get a better grasp of the volume, a larger volume is needed to serve as a 'metric' to compare enormous volumes too.  55 billion gallons is not a typical volume.  Therefore, a larger volume is needed.  On a previous blog post on this site, Lake Tahoe has been used as a metric for extremely large volumes -- which this qualifies as that category.


Below is a picture of Lake Tahoe from Space:
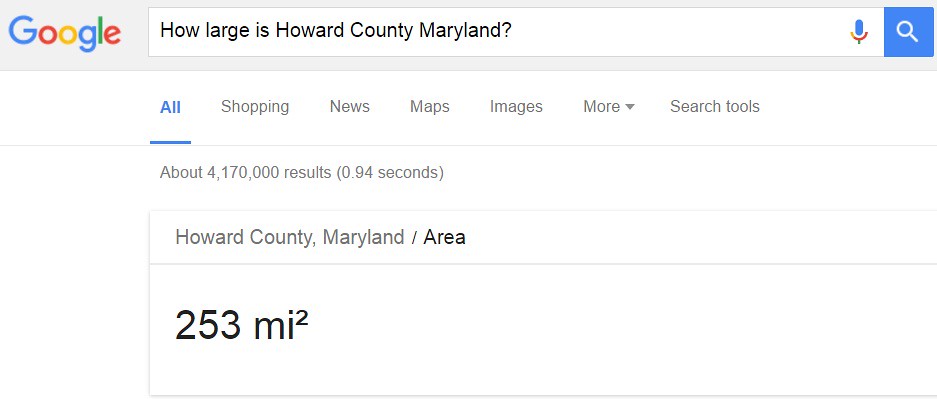


Source: Snow Brains


Upon inspection of the photo above, Lake Tahoe is a huge lake.  The total square area of the Lake is 191 square miles.  In order to use this value as a reference to cast 55 billion gallons of rainfall into perspective, a little math will have to be performed.  But, we will take the process slow.  If at any point, you (the reader) need clarification, please leave a comment in the blog post below.


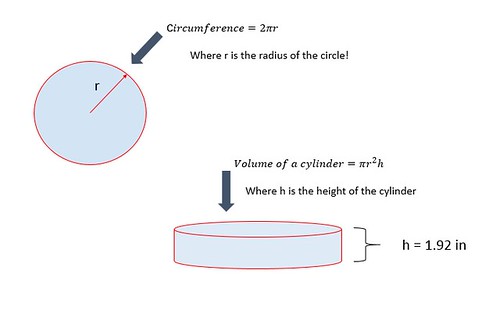
To start with, an equation for the volume of Lake Tahoe is needed.  Above, the surface area of Lake Tahoe is given as 191 square miles.  An expression (or equation) for the volume of an irregular shape like a lake is the following:


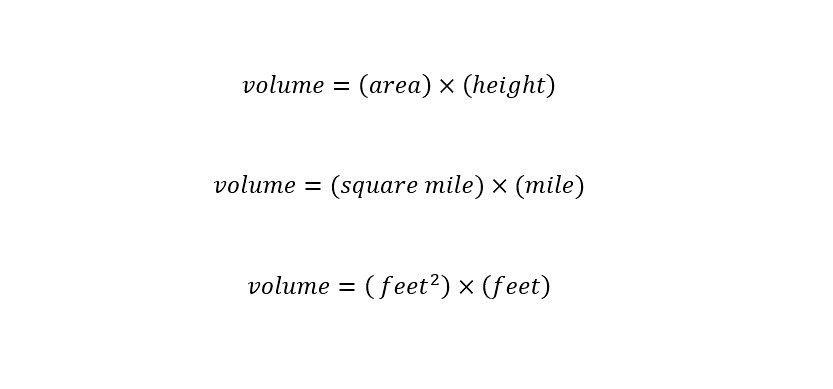
According to the expression above, the volume can rainfall can be determined by knowing the amount of rainfall that a storm delivered across a surface.  Meaning, if a circle is the two-dimensional surface, then by understanding how much water fell on the circular surface, the determination of the volume of a cylinder is possible.  By the way, the units of volume are 'cubic feet' or 'cubic mile' - etc.  Cubic feet is most likely easier to visualize -- since most of us have an idea of the dimension of a foot is in comparison to inches of rain.


Since in the present case, a volume is known, then in order to understand the magnitude of 55 billion gallons the question becomes the following:


How many feet would Lake Tahoe rise if 55 billion gallons were dumped into the Lake?


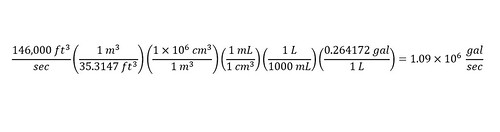
In order to start the calculation, a unit conversion is required to move on.  The second line of the volume expression states volume in terms of 'units of miles'.  This is not useful when discussing rainfall -- which is usually reported in units of 'inches'. If the calculation is carried out with units of 'miles,' then the results of the calculation would be expressed in 'miles' -- which would be difficult to interpret.


Rather than get an answer that is difficult to interpret, a conversion can be performed to units of feet from miles.  There are 27,880,000,000-square feet in a square mile.  With this conversion factor available, the units conversion is easy and shown below from square miles to square feet:


Next, take the answer (in square feet) and plug the value into the original volume above:


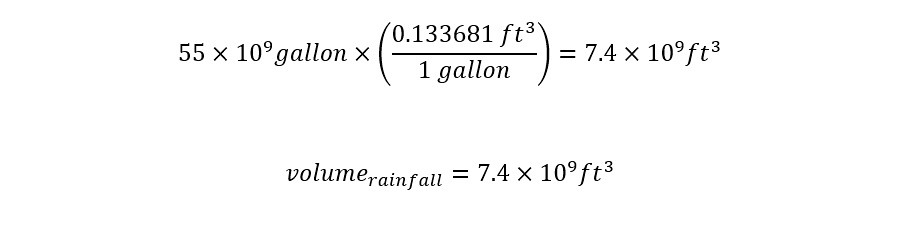
Shown above is an expression for volume with a value for the area (191 square miles) inserted.  There are still two unknowns left -- volume of rainfall and height.  In order to plug a volume into the above expression, a 'unit' conversion is necessary from 'gallons' to 'cubic feet'.  There is 0.133681 cubic feet in 1 gallon.  With the conversion factor in hand, the conversion is simple as shown below:


Next, if the volume of rainfall is plugged into volume equation above, we are left with one equation with one unknown (height) as shown below:


If we rearrange the above expression to solve for height from the total volume, we get the following:


Wow.  The following result states that if 55 billion gallons of water was dumped into Lake Tahoe, the water level would rise 1.4 feet in total.  That is just under 18 inches (1.5 feet).


Can you visualize the change in height?


Of course - why?  Because, I am 5 feet 7 inches tall.  I could stand next to the Lake (shown below) and visualize roughly the water level rising to my knees.  I can easily imagine Lake Tahoe filling up by 1.5 feet.  What I did not realize is that Lake Tahoe is enormous.


Further, take that measurement and look out onto the Lake and the visualization of 55 billion gallons comes into focus.  The choice of Lake Tahoe as a metric fits the dimensional analysis much better.  Half the battle in performing dimensional analysis problems is choosing the correct 'units' and 'metric' by which to compare the stated (reported) value in the popular news to.


Again, here is another picture of Lake Tahoe shown below (not from space):


Source: Lara Farhadi


Conclusion . . .


In the paragraphs above, a couple of metrics (world's largest pool and Lake Tahoe) to cast the enormous volume of 55 billion gallons of rainfall into perspective.  Both volumes represent two extremes of the entire spectrum.  Using the process of dimensional analysis, we were able to compare the volumes to the reported volume of 55 billion gallons.  Prior to this analysis, any attempt toward understanding the true magnitude of the statistic.


Too often, reading the news results in a lack of understanding of the true magnitude of large numbers.  Whether these numbers represent volumes, heights, miles traveled, electricity generated, there is a need to try to understanding them.  The avenue by which to do so is through 'dimensional analysis'.  The process is rewarding when you arrive at a result.  Regardless of the result.  Often times, more thought and analysis is needed to make further sense of the statistics.


Until next time, Have a great day!


Sunday, July 31, 2016

How Much Rain Did Elliot City (Maryland) Really Receive?

Scrolling down twitter, I found a link to the following video from ABC News regarding last night's torrential rain in Elliot City, Maryland -- shown below:


Based on the past blog post topics regarding "floods" and large volumes of water, I could not help but wonder how much water really fell on Elliot City.  Elliott City is located within Howard County (Maryland).  Below are the results of reported statistics of rainfall.


How Much Rain Is In 12-Inches Of Rain?


According to an article on the news website "ABCnewsgo.com" titled "Flash Flooding, Storms Cause Havoc in Parts of Maryland and New Jersey" between 10-12 inches of rain has fallen over Howard County:


Video captured on Instagram showed cars on at least one street in Ellicott City being carried away in what looked like a tide. A state of emergency was declared for Howard County, and local ABC affiliate WJLA-TV reported "10 to 12 inches of flowing water" along with damages that would take "days to weeks of clean up."


The flash flooding caused a tremendous amount of rain to fall.  In New Jersey, the situation is not better.  Here is another excerpt from the article above:


 In Princeton, New Jersey, water reached waist-deep levels, and in Plainsboro, New Jersey, WABC-TV, an ABC station in New York, reported that cars were rendered immobile by floods, and that there were power outages around that region. Six inches of rain hit parts of the state.


These descriptions along with other articles and video on the internet show an unprecedented amount of rain falling on the region.  In order to fully grasp the content being shown on various websites, a few calculations need to be done to cast the volume of rain into perspective.   Through dimensional analysis, we can figure out the volume of the rain that has been dropped on the entire county (by approximation) and then use a metric to cast that volume into perspective.  Lets start.


To start the calculation, we need to know the area of Howard County (in Maryland).  How might we find that value?  Why not ask "Google.com"?  Here are the results of my search below as shown:


The total area of Howard County is 253 square miles. Next, according to the news account above, the area received around a foot of rain (reported 10-12 inches).  Remember, the calculations are approximations to inspire readers to think about the relative volumes of rain that come with such natural disasters.


In order to calculate a volume, we need to have an equation for volume -- which is expressed as follows:


Since we know an area (expressed in units) in square miles, a conversion will be necessary given that the reported height in rainfall is expressed in units of "feet."  The conversion factor from square miles to square feet needs to be obtained.  Again, why not ask "Google.com"?  Here are the results:


For ever square mile, there are 27,880,000-feet.   Roughly, Twenty-Eight million square feet per square mile!   With the conversion factor known between units in hand, the calculation can be accomplished as follows:


The number 7.05 billion square feet is the area of Howard County expressed in units of square feet.  First, notice that the number is significantly greater than 253 square miles (which is good) -- signifying that the units are correct.  Next, the area is one part needed to carry out the calculation of the total volume of rain in the equation above.


With the height of the rainfall reported to be around a foot (12 inches), the volume expression shown above can be solved as shown below to calculate the total volume of rain:


That is an extremely large number of cubic feet of rain.  I like to view a numerical value for volume in units of gallons.  I can easily open the refrigerator up in my house and look at a gallon of milk to get a rough idea of the basic unit - the gallon.


The conversion factor between cubic feet and gallons can be obtained from a previous blog (written about the recent torrential rainfall in China).  In every cubic foot of water, there are 7.48052 gallons of water.  With this in mind, the calculation of converting units from cubic feet to gallons is straightforward and shown below:


All together, the total rainfall that Howard County (in Maryland) received was an astounding (an incomprehensible) 53 billion gallons.  How can we get our heads around the value of 52.7 billion gallons of rain?  Lets try using a metric below to visualize .  Read on to find out!


How Many Empire State Buildings Could be filled?


To really understand the magnitude of that volume of rain, a proper metric is needed.  How about using the Empire State Building?  Here is a picture taken from the "Wikipedia" page shown below:


Source: Wikipedia


How many Empire State Buildings would be filled with 7.05 billion cubic feet of water?


In order to carry out the calculation, the volume of the Empire State Building (shown in the picture above) must be known.  If you do a search in "Google.com" you will find the answer to be located on a website "ESBNYC.com" with a stated value shown below:


Bullet statement #6 states that the total volume of the Empire State Building is 37 million cubic feet.  Wow.  That is large.  How does 37 million cubic feet of space compare with the total volume of rainfall across Howard County of 7.05 billion cubic feet?  Obviously, the answer will entail a multiplication factor between the two.  The calculation of the number of Empire State Buildings that would be filled is shown below:


Wow, Wow, Wow!  The result really drives home the point of using dimensional analysis to cast a metric to put the volume into perspective.  Although, as with other large volume analyses on this website (click on the tag Large Volume Analysis to access all), the number of structures that could be filled are truly incomprehensible.  Although, the utility of performing dimensional analysis is to give the reader an idea of the scale of the problem (or natural disaster).


What do I mean by the last sentence?


Upon calculating the number of Empire State Buildings that could be filled to be 190 buildings, one can try to visualize the following:  Imagine spreading the volume of 190 Buildings stacked together over an area of 253 square miles.  The volume would obviously shrink as the area increases to eventually cover 12 inches.


After spreading the volume contained in the Empire State Buildings out to an area of 253 square miles, the picture would look like the following taken from "Twitter" shown below:


In the picture above, the cars are being carried down the street by the rainfall which resulted in extreme flooding.  Regardless of the analysis that we try to perform here on this site, any loss of life is incomprehensible as well.  Natural disasters cause a person to take a step back and appreciate what life we have.  I hope that you do the same too as watching this one unfold on social media.


Conclusion...


Any loss of life due to natural disasters is a terrible thing to have to consider.  The amount of rainfall that fell over the weekend on Elliot City and broader -- Howard County inflicted great damage.  The analyses here showed the volume to be around 190 Empire State Buildings worth of water.  Yes, that is correct.  The amount of rainfall could fill 190 buildings -- Wow.


For a homework assignment, figure out the amount of Mercedes Benz Superdome (pictured below) that could be filled with the equivalent volume of water.


Source: Wikipedia


Before you carry out the calculation, take a guess whether the amount of Superdomes would be greater or lesser than the amount of Empire State Buildings.  Provide your answer in the comments sections below.  Until next time, have a great day!


Wednesday, June 15, 2016

1,600 Cattle Consume Equivalent Amount Of Water As A Bel Air Resident Per Day?

All of us view the world from a different perspective.  Literally, each of us look at the world from a different set of eyeballs -- which by definition means -- we see a different picture.  Further, each of us view the world through our respective interests, occupation, life experiences.  Why do I mention this obvious observation?


Recently, I was in Nebraska on vacation or to visit family more specifically -- which was much different than California.  The inevitable discussion emerged between my brother-in-law, his boss (a cattle rancher) and myself centered around the drought in California.  Any time that people from other states in the U.S. (either visiting or welcoming a visitor - me) find out that I am originally from California, a discussion emerges surrounding the drought crisis in California.   Often times, I learn a new fact or piece of information that I previously did not know.  In this instance, I learned that a farmer's dimensional analysis of a water crisis is projected in terms of cattle (not surprisingly).  Below are the details of this wonderful and informative interaction.


Cattle Consume Water?


Of course cattle drink water!  That did not surprise me in the least.  What did surprise me was the discussion surrounding the drought in California.  Over lunch (as mentioned above) a discussion emerged that had do to with the continuous drought conditions in California.  My brother-in-law's boss was grilling me about California.


Not surprising since I stuck out in the restaurant like a "sore-thumb".  Why you might ask?  Here is a picture of my brother-in-law and his boss below:


As we were discussing the drought in California, I decided to throw out on the table one of my newly discovered statistics about water usage in California.  Which of the many do I speak of?  I decided to discuss the difference in water consumption in water use -- which I wrote a blog post about a few months back.  Here is the main statistic that blew my mind from Harper's shown below:


Over lunch I went ahead and gave a quick statement to invoke a response of surprise between the two residents of Los Angeles.  I stated the the typical LA resident uses 107 gallons of water per day.  He was not surprised at the amount.  Next, I stated that the average 'Bel Air' resident uses 32,000 gallons of water per day.  WOW.


What was his response?


He rapidly returned with the statement: "On a hot day, one of my cows will drink max 20 gallons of water.  I guess that equals 1600 cattle then now doesn't it."


I had to stop and run the math in my head for a moment.  I was amazed at his perspective.  In retrospect, as a cattle rancher, this makes perfect sense.  He is concerned from the standpoint of how much water is required to keep his cattle optimized.  I will show the calculation below:


There are two avenues by which to verify the cattle rancher (Scott's) quick calculation.  First, take both of his numbers and multiply them together.  Second, divide the total number of gallons by the number of gallons per cattle to get the total number of cattle.  Either way, the calculations are straightforward.  You might find yourself asking the following question:


So what?  Big deal -- Everyone knows that Bel Air residents are outrageous water consumers?


True.  From that conversation, I took home a few pieces of information -- which I will share:


1) Each of us look at life from a different perspective.


2) Each of us have our own reference point.


3) Each of us are unique.


4) Each Bel Air reside consumes as much water as 1600 cows on a daily basis!!!!


Conclusion ...


Look, I have wrote blog posts in the past about the outrageous use of water consumers here in California.  Also, I have wrote about the amount of rain in a few inches of rain fall.  I have to admit that this is the first time that I have used cows as a tool for dimensional analysis.  The results are staggering.


In closing, each of us have a different perspective on how to view life.  Further, for a farmer in Nebraska, the mention of water usage causes him to 'default' to his cows -- which makes perfect sense.  Think about the number of cattle that could be drinking next time you turn on the faucet.  How many cows are you starving?  Until next time, have a great day!


Sunday, January 17, 2016

What is the volume of water in a few inches of rain?

Over the course of the week here in Southern California (USA), we have been inundated with rain fall -- which the weather service attributes to a large 'oscillation' of temperature in the ocean called "El Nino."  Regardless of the name of the storm, the water is much needed according to various news and State regulation agencies with all of the talk (over the last year) about 'droughts' and 'water shortages.'  What struck me about all of the reporting was that I have had a new found appreciation for numbers (in inches) reported of rain fall over a given geographic region.  To understand my new appreciation, I will have to go into a brief (could be a little long) back story which occurred over Christmas vacation.  Of course, the results of this tangent are very relevant and might shed light on all of the reported volumes of water reported in the news regardless of the season -- drought or heavy rain fall.


Volume Of Rain Flowing Down The LA River


I start with the question: How much rain is flowing down the LA river?  The reason why I chose this question in particular was due to a couple of recent news items sent to me electronically by friends.  First, a friend posted a video on Facebook shown below:


Below the video in the notes the following message appeared regarding the video:


Is the California drought a scam?

"An inch of rainfall in L.A. generates 3.8 billion gallons of runoff, so you're talking about more than 12 billion gallons of water that could be captured, but that flows within hours down our concrete streets and into the ocean. There’s enough rainwater to be harvested to produce 30-50% of the entire city’s water needs."

"About half of the rainfall flowing down the Los Angeles River in a typical storm is lost to the ocean, according to the Water Augmentation Study from the Council for Watershed Health, a L.A.-based environmental organization. Most of the rainwater that bounces off roofs, parking lots, streets and sidewalks ends up in storm channels that flush rainwater into the ocean. That amounts to 10  billion gallons from an average rainstorm, enough to fill 120 Rose Bowls, said Alix Hobbs, president of Heal The Bay."


I have to admit, the video is not exactly the same video that I saw on Facebook.  Still, the video appears to be very similar and to drive home the point of water just flowing out to sea.  The posts on Facebook are labeled with concerns about 'wasted water.'  Of course, the problem here is that the water is dirty and would need to be treated downstream and purified to be of any use to residents.  With the exception of watering crops possibly (maybe).


The point is: the video above shows a massive amount of water due to just a couple of inches of rain fall.  A statistic of 10 billion gallons is reported by the author above.  Is this really correct?  Can that much rain be falling from the sky and equate to a couple of inches of rain?


In a recent Los Angeles Times article titled "El Nino Rains Get LA Rivers Roaring To Life" the author reports an extremely large magnitude of volume of rain that is attributed to the El Nino storm.  A video is attached to the article showing the flow of water down the LA River.  I would recommend watching the 30 second video before continuing to read. The reported large volume is reported as a function of flow rate:


The river at its peak can move 146,000 cubic feet of water every second. At its normal rate, the Colorado River, sculptor of the Grand Canyon, doesn't do a quarter of that.


 In the future, I will understand why reporters love to cite volumes in 'cubic feet.'  For now, we just need to understand how many gallons/second is that equivalent to?  The first calculation that I will perform (or show) will be the conversion of the 'flow rate' of 'cubic feet/second' to 'gallons/second.'  I can think more clearly using units of 'gallons' rather than cubic feet.  Below is the conversion:


Next, I asked myself, how long at the flow rate would the river have to flow in order to equal 10 billion gallons.  Here is the calculation below:


Just over 2.5 hours -- Wow!!! That fits nicely with the values reported in the video notes.  Meaning, that if water is flowing down the LA River, accumulating 10 billion gallons is not inconceivable.  Not in the least.  Of course, the flow rate used for the calculations is based on the 'maximum' speed recorded of the LA River in history.  Regardless, the important message is that given enough time, a large amount of water flows down the river -- which would call into question the need to scare the public about droughts in California.  I realize that the water is not usable directly from the river.


You might be wondering why I am thinking about the subject.  I mean, aside from the recent storms that have hit Southern California over the past week and a half along with the blaring news bites about 'El Nino'.  Part of the answer lies in the fact that I had large amounts of water on my mind when writing the earlier post regarding the flood in Brazil as a result of a damaged dam due to mine waste water.  The other part is due to news which I received over the winter break visiting family.


How Many Gallons Of Water Equals 2 inches Of Rain?


Over winter break, we got together with family.  Getting together means talking about current events.  One current event was the rainfall that was hitting the Lake Tahoe region.  The reason being is that my brother-in-law's family lives up near the lake.  Each year, my sister and her family go and tear up the ski slopes for a few days.  Therefore, their interested in storm reporting in the region.


Anyways, during a conversation regarding the weather up in the region (Lake Tahoe), I heard a number which blew my mind.  I almost thought that I had a hearing issue.  I asked for clarification and sure enough, I had heard correctly.  The number in question was the amount (volume) of water that filled up 1.92 inches in Lake Tahoe was equivalent to 63 billion gallons.


At first, I did not believe this number to be correct.  In fact, had I not previously been entertaining the number (15.9 billion gallons) which was equivalent to the mining spill in Brazil, I really would have thought my family to be insane.


When I got home, I immediately looked up the number.  Sure enough, according to the news site 'KRON,' a heavy storm dumped enough rain to add 60 billion gallons of water into Lake Tahoe.  Here is a 'tweet' that I found on the new sites Twitter account shown below:


After finding the tweet shown above, I just still could not wrap my head around the gigantic volume of 60 billion gallons correlating to just 1.92 inches of rain.  I would believe more height to be associated with that volume.  Why did the volume bother me terribly?  I guess because I had not yet checked the number with a calculation of my own.


First, I think a little perspective might be needed at the moment to visualize this massive amount of water.  If you have never visited Lake Tahoe, then the volume of water contained in the lake is truly unimaginable.  The shoreline perimeter is 72 miles around the entire lake.  One can even see the lake from space.


With the information about the LA River along with the image above, the volume reported does not seem outlandish.  Although, at the time that the number of 60 billion gallons was reported to me, all of the above information had not been known to me.  I had to do a small amount of research -- which is part of this post.  


In fact, when we (you and I) hear or see statistics, we should not just take them at face value and believe them.  A small amount of research can go a long way -- as you will see shortly.  Without knowing much, how could a person check to see if the number was correct?  


How can the volume be determined knowing the value of both perimeter and height?


Well, knowing the value of the perimeter in miles allows us to carry out an approximation to determine the volume.  We could approximate the lake to be a circle and then figure out the volume based on an equation for a cylinder.  Below, I show the approximation I made initially to do a 'rough check' of the reported number.


In the picture above, a circle is shown with a 'circumference' (as "C" equal to 72 miles -- perimeter of Lake Taho) which is equal to a factor of 2pi multiplied by a 'radius'.  Since the 'circumference' is known, the 'radius' can be determined through rearranging the equation -- as shown below.


The calculated radius is expressed in units of 'miles'.  In order to calculate a volume of a cylinder with height expressed in units of 'inches' then the radius must be converted from 'miles' to 'inches' as shown below:


With the radius known, the next step toward figuring out the volume of rain that correlates to the 1.92 inches of rain that was deposited into Lake Tahoe is to use the equation for the volume of a cylinder.  In the same picture with the circle, there is an equation for the volume of a cylinder.  A factor of pi squared multiplied by the radius and height gives the total volume of a cylinder as shown below:


The volume is expressed in 'units' of cubic inches -- which might not be useful for most people.  Unless, of course, you think in terms of cubic inches or cubic feet, etc.  To each his own!  I am more comfortable with gallons and since the article cites water volumes in gallons -- we will stick with that unit.  Therefore, below the equation for the volume, I converted the volume expressed in units of cubic inches to units of gallons using dimensional analysis.


According to my approximation using a circle, the answer (for volume) is short compared to the value reported by the news (KRON) of 63 billion gallons.  Why?  Ask the following questions:


1) Is the 'run-off' water from surrounding region (the mountains) the difference in volume?


2) Is the approximation of a circle that far off?


3) Is there a more accurate way to calculate the volume?


I had these questions after calculating the differences in volume.  One of the most powerful advantages of having access to 'social media' is the ability to ask questions.  I decided to inquire into the difference between the number I calculated and the reported number.  In order to inquire into the difference, I had to find out where the number (reported number) originated.


-Transparency in reported numbers is needed


I started looking into the origination of the reported number of 63 billion gallons of water that was supposedly dumped into Lake Tahoe.  What I found was very interesting.  You might find the answer to be drawn out, but that is how research is done on a everyday basis.  Why should investigating the source of a 'reported value' be any different?  The methodology is the same as shown below.


First, I found an interesting article upon investigating further the source of the volume of 63 billion gallons of water which differed from the original value.  The 'SF Gate' reported a number far less than either the original value (63 billion gallons) or our calculated value (14 billion gallons).  Their value was based on a 'correction' of 6.3 billion gallons.  Wow!  The difference being nearly 57 billion gallons from the original value and half of our calculated value (14 billion).  What is going on here?


I decided to turn to social media (Twitter) and ask KRON about the difference in values as shown below:


Shown above is the inquiry to which I have yet to receive an answer from KRON for.  I decided to find out where the news organizations got the source from.  After searching into the twitter accounts of both KRON and SFGate, I found that the source originated from the National Weather Service -- Reno office.  Finally, I found the source on their Twitter feed shown below:


Above the tweet is another correction to the original reported value shown below:


The correction was to the value reported in "Acre-feet".  I wondered if another correction would be issued for the value reported in 'gallons.'  I decided to ask the NWS Reno by tweeting to them as shown below:


I included the article reporting the difference in volume -- which was significant -- below:


I waited for an answer and expected one.  Not really.  Although, a few news agencies are good at getting back to an inquirer quite quickly.  Therefore, if you have a question, go ahead an ask someone via 'social media'.  You might be surprised at the ability to get a question answered.  Since the question above was to a government agency, my expectation was low.


A few days later, I was pleasantly surprised when an employee from the National Weather Service at Reno responded to my question on Twitter.  Shown below is the response:


The forecaster that performed the calculation was Tim Beardsley from the NWS Reno.  As indicated above, the initial value that was calculated was off by a factor of 10.  Meaning, that the true number was 6.3 billion gallons of water NOT 63 billion gallons of water.  Additionally, you can see that I still asked to see the equation or method that Tim used to calculate the value.  I was left still unsatisfied.


Surely, I should be able to calculate the value to within the same 'order of magnitude'.  At this point in time, I had to wait for another response.  Keep in mind, this correspondence was occurring over the holidays.  I was surprised that any responses were given.  The first week in January, Tim Beardsley responded with the method that he used to calculate the volume of water into Lake Tahoe corresponding to 1.92 inches of rain fall.  Shown below is his response on twitter:


After reading his response, I could see that his method was simpler.  I did not realize that a value for the surface of Lake Tahoe was known.  I felt rather stupid -- brain fart.  Of course, use the area of the lake and then multiply that value by the height -- as shown above in the equation for the volume of a cylinder.


To verify his calculation, I repeated exactly what was reported above in the tween response.  I show the results below:


As you can see, the calculation is easier than our approach.  The calculation is simplified by having the 'area' -- which is equal to (pi multiplied by the radius squared).


Still, the question remains where the difference of almost double the volume comes in.  I imagine that the difference is due to the calculation of the perimeter distance.  Or that Lake Tahoe is not a perfect circle.


Conclusion


Regardless of the true value reported here by the news organizations, a few observations can be made in conclusion:


1) Do not take a value reported by the news as to be 'absolute truth'.


2) Different methodologies of calculating volume can give VERY different answers.


3) Different answers have VERY different meanings.


Again, no one is perfect as shown above.  There were two considerations that were not discussed in the blog post among others (I am always open to suggestions).  The first was that in the corrected twitter post by the NWS Reno, the value of 'acre-feet' was off by an order of magnitude.  A large difference exists between 196,100 acre-feet and 19,600 acre-feet.  How large? Exactly 176,500 acre-feet.  How did that difference arise during the calculation?


The second consideration was that there exist a second method by which to calculate the total volume of rain fall by hydrologists.  According to the explanation above from the NWS Reno, a 'Rating Table' is used by hydrologists (click here).  Regardless, a greater degree should be a goal of the National Weather Service in Reno regarding the method of calculating weather conditions.


A few readers might not agree with the last statement regarding organizations being more transparent with their methodologies.  Ask yourself the following question:


How many times have you looked out the window after looking at the weather forecast and said "Wow, the weather channel really got that wrong?"  "I wonder how the weather channel came to this conclusion?"  This should warrant a greater degree of transparency -- for those interested in understanding the methodologies used.


As I have shown above, the amount of rainfall that drops on Southern California is quite large.  Not just quite large, but HUGE.  Scientists and engineers should be trying to come up with methods to capture this water for alternative methods.  Or at least building 'floatable turbines' or another method to turn the mechanical energy (the energy of flow of water) into electrical energy.  What do you think?  How would you harness that power?  Until next time, enjoy pondering the numbers reported in the post.  Have a great evening.

Saturday, December 26, 2015

Volume of Waste in the Mine Spill (in Brazil) Equivalent to 78 Deepwater Horizon Oil Spills

Last Sunday, the Los Angeles Times ran a piece on a recent 'environmental disaster' in Brazil that has been unfolding over the last month.  The title of the article was "As Brazil Mine Spill Reaches Ocean, Its Catastrophic Extent Becomes Clear."  I was reading the article in a hurry and did not really get a chance to digest the entire piece.  What I mean is -- upon reading the article a second time through, I found myself astounded.  In between the first and the second reading, I realized that the reported values fit perfectly into the theme of blog posts on this site.


As I mentioned above, between the two readings a couple of events transpired.  I think honesty is a good practice -- to admit that I am not perfect.  After I read the article the first time in a rush, I e-mailed the author and asked him for more information.  Specifically, the first paragraph states the overall 'eye-catching' general consequences of the disaster:


Since millions of gallons of mining waste burst from an inland iron ore mine a month ago, 300 miles of the Rio Doce stretching to the Atlantic Ocean has turned a Martian shade of bright orange, and the deadly consequences for residents and wildlife are just beginning to emerge.


I posted a question on the author's twitter account to inquire into a more definitive quantity of waste water that was actually spilled in the disaster.  He responded by informing me that a more accurate estimate of the total volume was listed in the article.  I quickly read the article for the second time, looking for a volume listed.  This is what I found:


The dam near the inland city of Mariana that broke on Nov. 5 is operated by Samarco, a mining company owned by Brazilian mining giant Vale and Anglo-Australian mining giant BHP Billiton.
When the barrier burst, for unknown reasons, more than 60 million cubic meters of waste began flooding nearby communities and wound up in the Rio Doce.


Without talking about the long-term environmental effects (which will be covered in a later post), I wanted to focus on the magnitude of waste released from the damaged dam.  After exchanging correspondence with the author, I was looking for a reported/stated value of waste water expressed in 'units' of 'gallons' rather than 'cubic meters.'


Whenever you express a value, the importance of keeping uniformity (in reporting units of measurement) cannot be understated.  This is to avoid confusion.  In the situation described above, I was expecting to find a total volume of the mine spill expressed in units of 'gallons' rather than 'cubic meters.'  Regardless, the value was expected to be large based on the picture in the article -- which are shown below:


Source: LA Times -- Brazil's Rio Doce River


My curiosity started to run wild.  I could not get my head around the reported value of 60 million cubic meters.  What was the equivalent volume (60 million cubic meters) expressed in gallons?  Therefore, I decided to calculate the value in gallons using dimensional analysis.  Below is the the conversion based on the conversion factor of cubic meters to gallons (1 cubic meter = 264.172 gallons).


In the first line, the value of 60 million cubic meters is expressed in scientific notation.  The use of scientific notation allows large numbers -- extremely large numbers -- to be expressed more easily.  Regardless of notation, the number of gallons is HUGE.  The extent of the disaster is INSANE.  After I saw the number of gallons, I immediately started wondering how the number (15.9 billion gallons) compares to various volumes.  What volume would be sufficient to compare to the present 'man-made' disaster?


How many 'Deepwater Horizon Oil Spills' would compare to Brazil's mine spill?


Since the topic was a man-made environmental disaster, I immediately thought of the tragic 'Deepwater Horizon Oil Spill' back in 2010.    The oil flowed out of the well for 87 days and amounted to a total of around 210 million gallons.  That is why I was extremely surprised by the reported volume in the 'Times' article about the Mine Spill in Brazil.  I decided to compare the two volumes.  


Specifically, I wanted to know how many oil spills would be equivalent to 15.9 billion gallons of iron-ore waste.  First, I converted the value of the spill into scientific notation.  Then I divided the two volumes to obtain the number of equivalent oil spills.  Below are the results:


Wow!  Unbelievable.  I am blown away.  I cannot believe that the equivalent volume of the Mine Spill is comparable to 78 Deepwater Horizon Oil Spills.  That is a LARGE amount of waste water (iron-ore waste).  The volume was so large that I was still having trouble wrapping my head around the magnitude of the volume.  


As a result, I had to find another image to assist my inability to wrap my head around the value.  I found a photo from an article in the Wall Street Journal titled "Samarco May Not Shield BHP, Vale From Brazil Dam-Breach Repercussions."


The volume of iron-ore waste started to make sense after viewing the above photo.  Based on the photo above, that large volume would have destroyed a large area of land -- such as that above.  As the picture portrays, the water must have thrashed the town houses, cars, and forestry in the path as the potential energy of the stored water (in the dam) rushed out.  Again, that damage must have been due to a large amount of water -- like 15.9 billion gallons.  WOW.


Still left rather unsatisfied.  I am having trouble visualizing 78 'Deepwater Horizon Oil Spills.'  In light of this feeling, I decided to compare the value of 15.9 billion gallons to a couple other volumes: 1) the Mercedes-Benz Superdome and 2) the world's largest pool.  These two volumes are extraordinary feats of construction.  Further, the two volumes have served me well in past posts using dimensional analysis.


To start with the Mercedez-Benz Superdome in Louisianna.  The volume reported on the 'Wikipedia' site of the interior of the Superdome is believed to be around 3,500,000 cubic meters.  Below is a picture of the Superdome:


How many of these Super structures will be required to hold a volume of 15.9 billion gallons?  Below are the results:


Again, the number is large -- HUGE -- beyond comprehension.  The last remaining super structure that is appropriate to compare such a volume is the World's Largest Pool.  The World's Largest Pool is located in Chile and is shown below:


This amazing swimming pool holds an astounding 60 million gallons of water.  That is enormous.  Although, based on the mentioned volumes above, the volume of the World's Largest Swimming pool is starting to look rather small.  To be complete, the calculation was carried out.  Here are the results:


Oh my goodness, 265 swimming pools would be required to hold 15.9 billion gallons of water.  This should be too surprising.  Imagine what your guess would have been at the beginning of the blog post after hearing the initial value that was reported of 60 million cubic meters?  Would your guess have been larger, smaller, or equivalent to the calculated value?


Conclusion:


As I mentioned in the introductory blog post for this website, my intention was to demystify numbers that were reported in the popular news.  Further, to give the reader or you a better understanding how how a scientist thinks.  These objects, structures, or volumes were what came to mind while reading the above articles.  


Does that last sentence sound crazy?


If so, relax, and do not stress yourself out.  The world is full of diverse people.  I might not think like you.  Furthermore,  what questions arise in my mind might be completely different than those that arise in yours -- even after reading the same article.


Who cares about the value reported?


That is another story completely (and another blog post).  We might have different interests, concerns, questions when reading content in the popular news.  What unites us in this situation is that we both live on the planet Earth.  If these tragic accidents keep occurring, the toll down the line (in years to come) could be deadly to everyone (not just the Brazilians).


The first step toward being concerned about possible issues (some of which I will bring up in the 'follow up' post on this disaster) is the understanding of the magnitude of the problem.  As I mentioned, the first time that I read through the article, I missed the HUGE magnitude of the disaster (volume of waste) due to different units.  This shows how narrow-minded I was -- I am looking for gallons.   I should have slowed down and read the article more carefully the first time around.  How often do you have the same happen to you?  Reading too quickly to miss the content?  These are questions that each of us need to answer based on our own actions.


I hope that the disaster down in Brazil has been brought into a different light for you after reading this post.  Have a great day!