Showing posts with label Flooding. Show all posts

Sunday, October 9, 2016

How Much Rain Did The East Coast Receive From Hurricane Matthew?

News reports are surfacing everywhere on Twitter (and other social media outlets) discussing the devastation that Hurricane Matthew has brought to the East Coast.  Below is one example from the news site 'NBC News':


The devastation is without question.  What is questionable is the preparation of emergency agencies based on knowledge a few days (weeks) earlier with the disaster that unfolded in Haiti.  Haiti received an enormous amount rain -- which I wrote a blog about last week.  The amount of rain was so large that the summer storm in China which received a whopping 580 billion cubic feet was eclipsed by 750 cubic feet of rain.


Using the same approximations (land area, average rainfall, etc.), lets calculate the amount of rain that the East Coast has received to get a better grasp on the terrible Hurricane Matthew that has ripped apart and drenched parts of the world.


East Coast Receives Rain


As if the devastation to Haiti was not enough to contend with.  But Hurricane Matthew continued to drive up into the United States.  Various news accounts have given numbers which allow us to approximate and estimate through dimensional analysis the terrible amount of rain that have plagued regions.


To accurately assess the total volume of rain that has dropped on the entire East Coast as a result of Hurricane Matthew, each of the weather stations would have to report an average amount of rainfall across their respective region.  Not every region has the capability or funding to do so unfortunately.  Therefore, we have to rely and approximate based on whatever values are reported.  Hopefully, in the future, this disparity will change and weather prediction and storm forecasting will benefit to a large extent from such positive change.   The example I will use below is of the tremendous amount of rainfall that has hit the state of North Carolina in the last few days.


According to the news site 'NBC News' in an article titled "U.S. Death Toll From Hurricane Matthew Rises to 17 Across Four States" reports were given of amounts of rain (listed in inches) fall to various regions:


By Saturday night, rainfall totals were 16 inches in Bladen County, 15 inches in Goldsboro, 12 inches in Lumberton and Smithfield, and 9 inches in Raleigh and Rocky Mount, McCrory said in a statement.


After reading the above statement regarding the amount of rain that fell on various counties in North Carolina, you might not be shocked.  Picture says thousands of words.  Remember that rain was not the only component that made up the devastating impact of Hurricane Matthew.  The other destructive component was the wind factor with speeds reaching into a hundred miles per hour in some places.


Compounding the destruction from rainfall alone, the wind can add to the destruction by imposing a force to be reckoned with.  Below is a video (just over a minute) from 'YouTube' to illustrate my point:


Watching the video above really drives home the destructive power of wind.  Too often, people watching the storm from a television cannot comprehend the effect of wind in a given storm.  Although, after rain has fallen or in combination with, wind can have very devastating and destructive effects on a given geographic area.  Especially, if the area is not built to receive that much rain.  This was the case with a storm in Elliot City (Maryland) earlier this year.


In order to understand the extent of the damage, a few calculations can be performed.  As I mentioned above, we can use the logic and approximations that we have assumed in earlier posts on this site.  First, we can find out the geographic area by looking in the 'Wikipedia' sites for the counties and regions listed in the excerpt above.  Using the same methodology as in previous blog posts of calculating a volume from the product of the area (geographic land mass area) and the height (of rain fall), a total volume will result from our efforts using the expression below:



I will list the area (in square miles) and height (in inches of rainfall).  After performing the conversion of square miles to square feet along with converting inches into feet, a final calculation can be performed. We can plug the values directly into the expression to obtain a volume.


Six regions were listed in the excerpt above: Bladen County (874 square miles), Goldsboro (24.8 square miles), Lumberton (15.7 square miles), Smithfield (11.4 square miles), Raleigh (142.8 square miles), and Rocky Mount (43.8 square miles).  It is important to note that each of these regions have a water component that was not included in the geographical area calculation.  This would increase the area of each region.  Additionally, the water component exacerbates the effects of a Hurricane like Hurricane Matthews.


Again, the outline of the calculations below will be as follows:


1) Line 1: Conversion of units of rainfall - from inches to feet.


2) Line 2: Conversion of units of land area - from square miles to square feet.


3) Line 3: Volume of rainfall - land Area multiplied by Height of rainfall.


With the values and order of calculations/conversions listed above, we can now calculate a volume for each region as shown below:
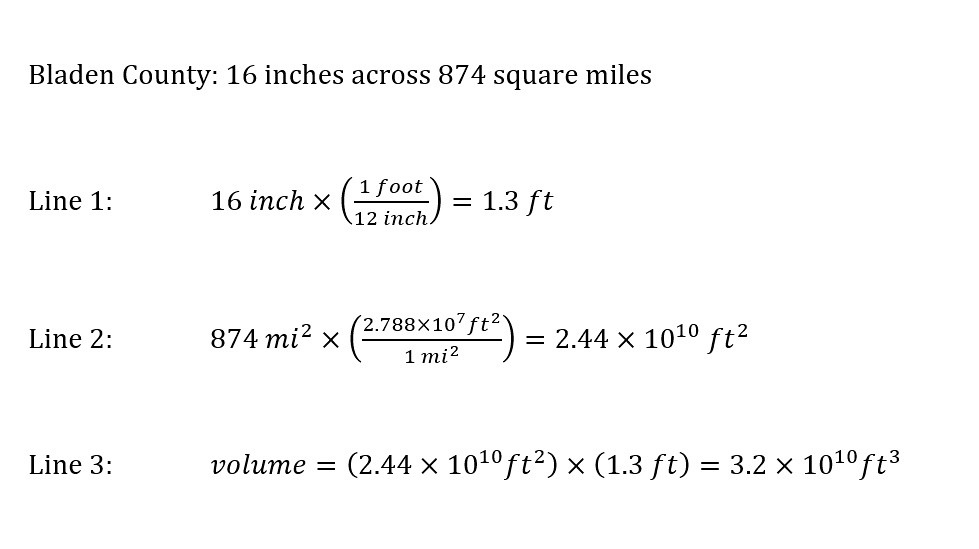
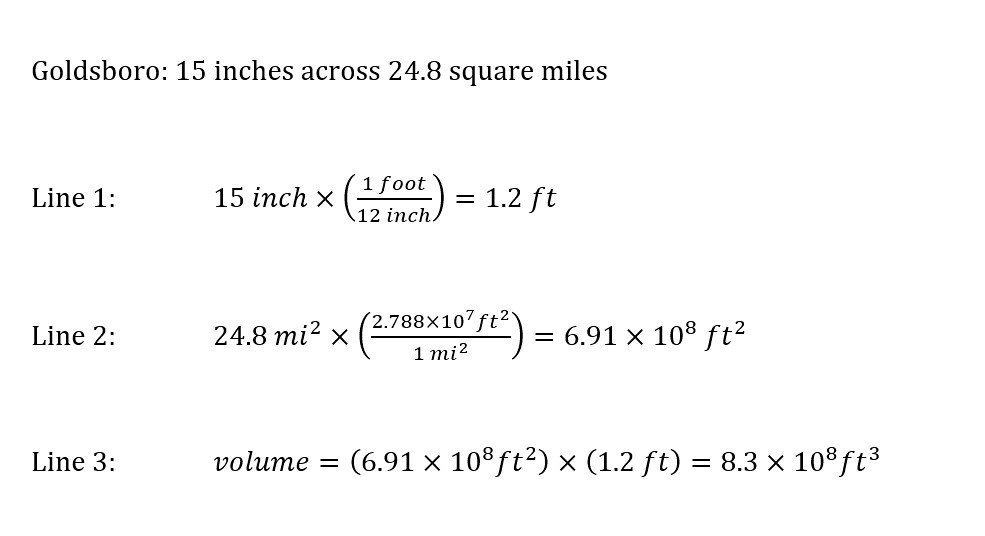
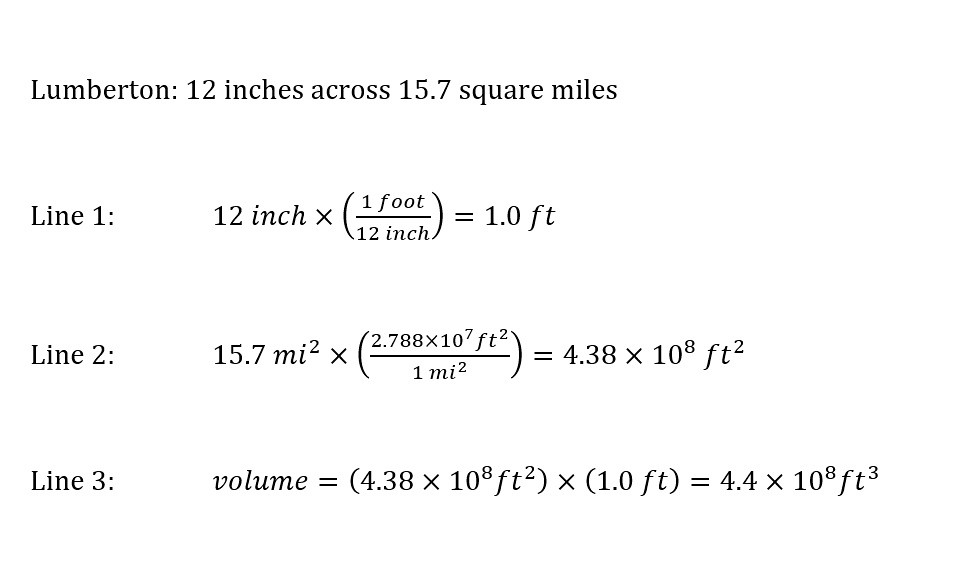
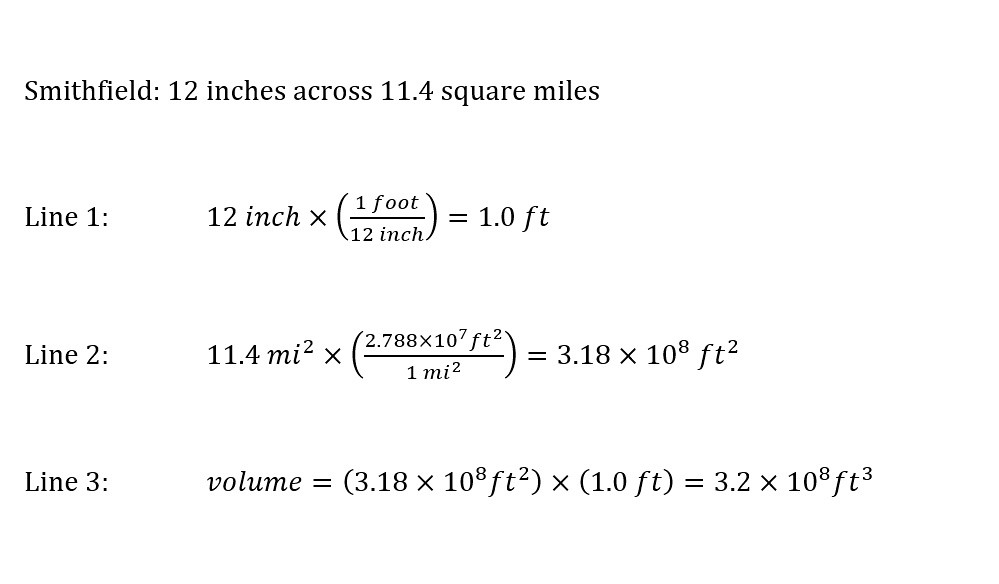

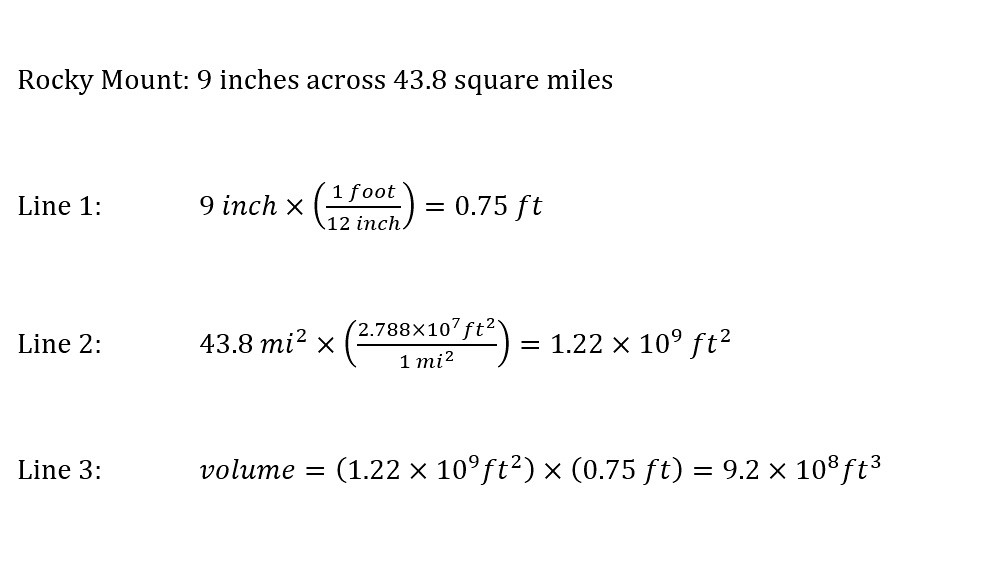


The volumes listed above are enormous in magnitude which are based on the reporting of the devastating effect of Hurricane Matthew in North Carolina.  As I mentioned above, the state of North Carolina has waterways dispersed throughout the state as illustrated below from 'Wikipedia':


Source: Alexrk2


The East Coast has received an amount of rain that has so far claimed the lives of 18 people (in North Carolina).  Understanding the magnitude of such disasters gives the reader an idea of the force of destruction that such disasters bring with them.  The news cycle is short compared with the long-term recovery process of natural disasters.  The need for accurate reporting and transparency is critical to convey the need for greater infrastructure for future disasters.  Disaster preparation is achieved through transparency and education.


Just in the last six months, the world has seen rainfall that is beyond comprehension in various areas of the US and beyond.  In the paragraphs below, I decided to illustrate the natural disasters in a different light.  The metric I have chosen is appropriate to some degree to illustrate the large volume of rain that has so far fallen on the East Coast.


How Many 'World Largest Pools' Could Be Filled?


The values reported above are enormous.  Well into the billions of cubic feet of rain have dropped onto North Carolina.  If the volume of rain that has dropped onto the six regions is accurately representative of the total rainfall that has dropped onto the entire East Coast, then the total amount is just simply incomprehensible -- to say the least.


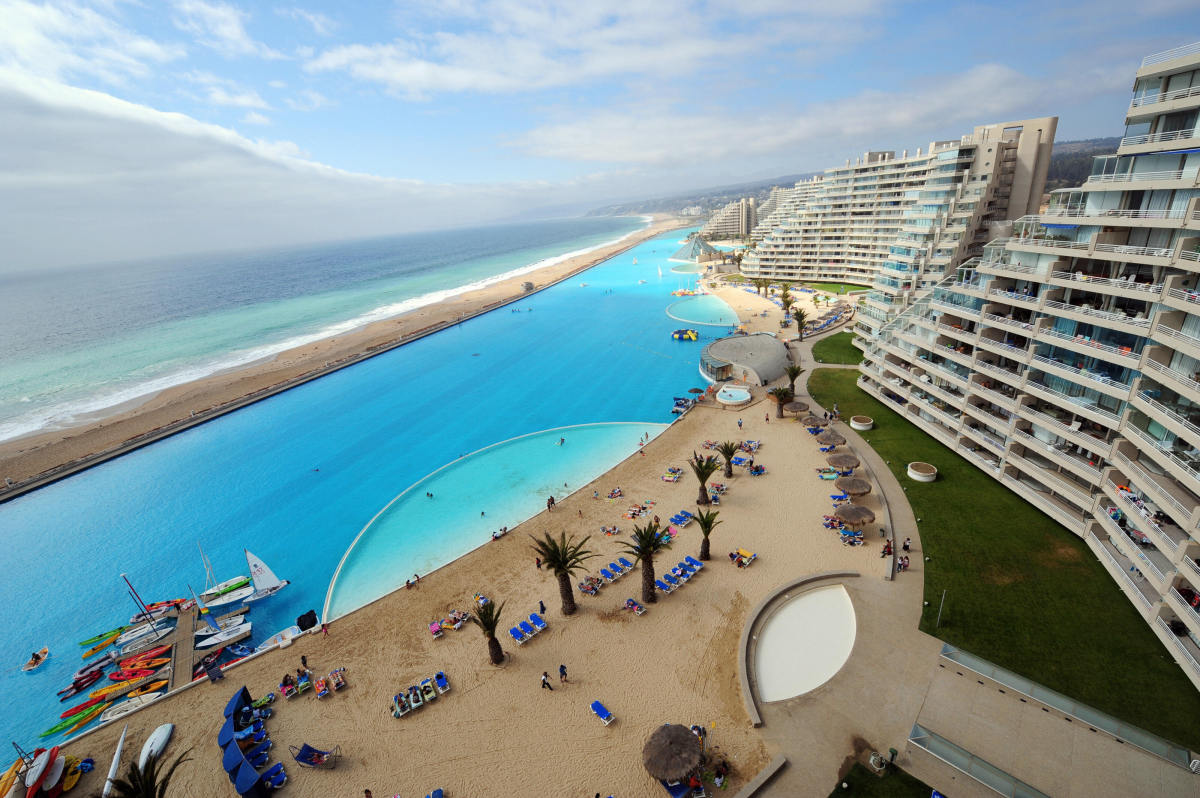
When such enormous amounts of volumes are encountered, an appropriate metric is the "World's Largest Pool."  This giant structure has been used frequently on this site -- starting with the first time last year.  Two pictures are shown below for a reference from the website 'Huffington Post':


And ...



Source: Huffington Post


The total volume of this mega structure that has the title of the "World's Largest Pool" is a whopping 60 million gallons.  Yes, you read correctly.  In the image above, a sail boat is shown in the middle.  Alternatively, there are hotel structures in the first image to give a reference to the size of amazing feat.


If we wanted to calculate the amount of rain in each region mentioned above in North Carolina during Hurricane Matthew, we could easily.  First, each volume would have to be converted from cubic feet to gallons.  The conversion would allow us to directly compare each volume as an integer value.  That is the ratio would be expressed as an integer value of the "World's Largest Pool."  From here on out, the "World's Largest Pool" will be abbreviated to "WLP".


Without further ado, lets figure out how many of the WLP could be filled with the respective volumes of rain.  One example calculation will be shown for the region of Bladen County in North Carolina.  All other volumes will be displayed in a table after.
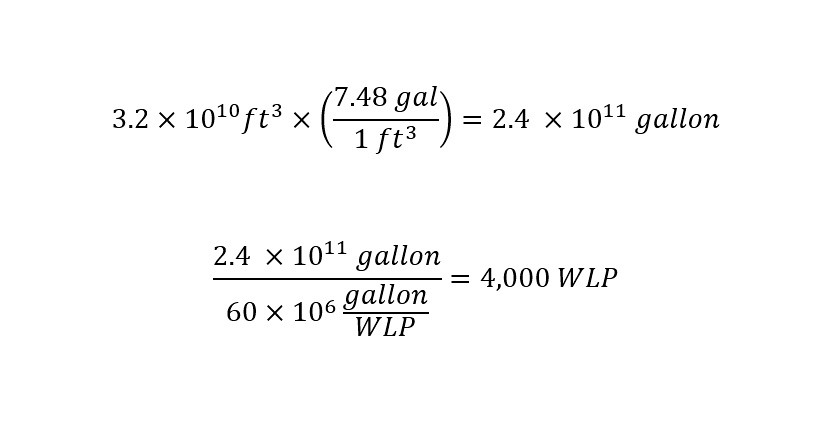


Just when you think that the numbers cannot get any larger, casting the values in different units (in this case US gallons) does just that.  Furthermore, as the result suggests, the amount of rain that fell onto Bladen County is enough water to fill 4,000 of the "World's Largest Swimming Pool".  WOW.


Using the "World's Largest Pool" or WLP as a metric really changes the volume of water.  Before the calculation, all that we were left with from the calculations in the first section were enormous amounts of rainfall expressed in units of cubic feet.  With the calculation above, one can easily view the pictures of the WLP and try to make sense of the number.  Furthermore, if that amount of water fell on any geographical region, there would be damage.


As I promised above, I would provide a table with the equivalent information as calculated above for other recent storms.  Think about the following storms which have been covered on this blog site: China, Elliot City (Maryland, USA), Huauchinango (Mexico), Louisiana (USA), and Haiti.


Here is the table with the values as promised above for comparison:
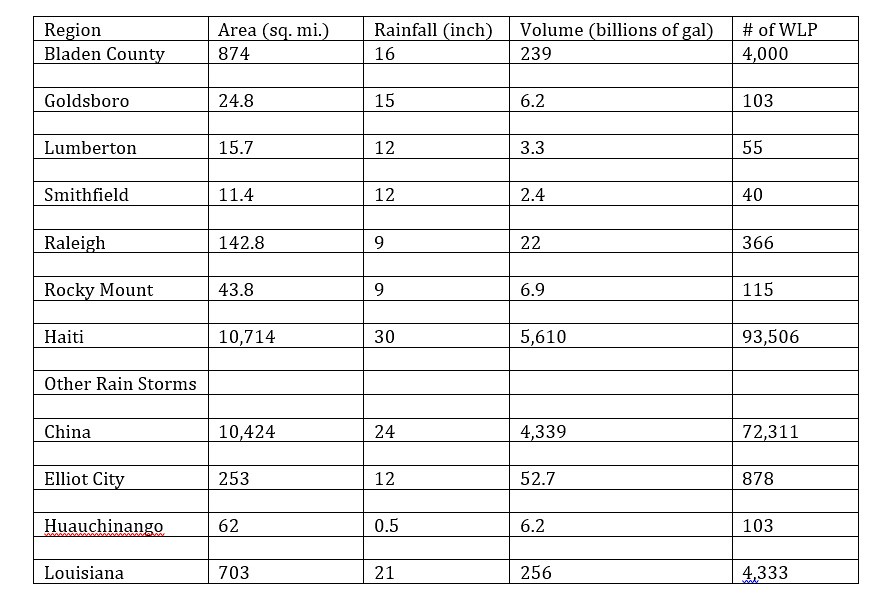


The importance of showing all of the data on the storms is to illustrate the damage caused by different amounts of rain.  Each storm is different.  Which is why the  continual update of weather models needs to be sought after.  Similarly, more money needs to be devoted toward improving storm calculation programs.  Additionally, more technology (sensors, stations, drones, etc.) need to be deployed to pick up data and feed the data back into the models to improve accuracy.


The tragedy caused by the storms this year so far are enormous and incomprehensible.


How do we move forward as a Nation?  


As a World?  


What about Climate Change?  


Are these linked in some manner?


These questions remain open ended along with others.  Although, as long as we move forward as a world thirsty for knowledge and thoughtful/mindful about the magnitude of such disasters, change can proceed in the correct direction.  Too often each of us proceed throughout our day with large amounts of stress and anxiety.  We do this without considering another force, the force of nature.  The force of nature can compound our stress and anxiety by hundreds of orders of magnitude.  Think of those put out of their homes by the storms recently as you stress at work.  Take a minute to think of those without power or water or a house.  Have a great day!


Tuesday, October 4, 2016

How Much Rain Did Haiti Really Receive?

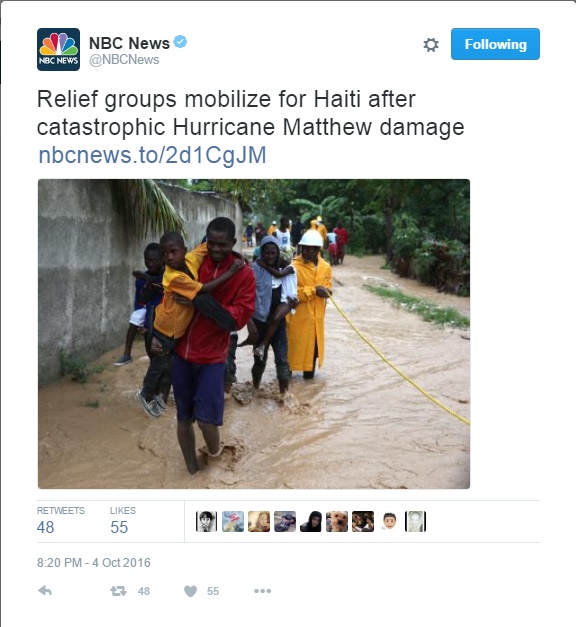
Tonight, as I was writing the blog I just finished on autonomous cars, I was scrolling through Twitter to find the original post and ran across the following tweet shown below:


Immediately, I clicked on the article to find out that Haiti received a significant amount of rain from Hurricane Matthew.  How much in comparison to other torrential rain storms this year?  Read onto find out.


How Much Rain Did Haiti Receive?


According to the news site "NBC News" which posted an article titled "Hurricane Matthew: Relief Groups Mobilize for Haiti After 'Catastrophic' Damage" an enormous amount of rain is expected to hit Haiti.  Here is an excerpt describing the magnitude of the storm:


The storm was expected to dump up to 20 inches of rain on parts of southern Haiti and southwestern Dominican Republic. Isolated areas could get up to 40 inches, the hurricane center said.


Instantly, after reading this, I stopped what I was doing and looked for an old post I wrote a few months ago on the massive torrential rain that China received.  Alright, I published the blog post that I was working on first -- in order to focus on the massive amount of rain that is expected to hit Haiti.


In order to compare the amount of rain that is expected to hit Haiti, I needed to calculate a total volume.  I will walk you through the calculations and logic in the following paragraphs.  Some of the values are approximations which I will try to clarify as we go.  If you have any questions regarding approximations or assumptions, just leave a comment.


With this in mind, first, we need to know how large (area in square miles) Haiti is in order to calculate a total volume.  According to the "Wikipedia" page, the total area of Haiti is 10,714-square miles.   The volume of rain was not reported in the news.  Although, a height was reported. According to the excerpt above, between 20 inches of rain in the Southern part of Haiti and 40 inches in other parts -- which could be approximated (grossly) to an average of 30 inches across all of Haiti.


Over the course of the next few days, news reports will refine their values and we can do a follow up comparison.  Specifically, we can then evaluate how far off our approximation was in this post.  For now, lets proceed with the calculation of the total volume of rain.


In order to calculate a volume, three numbers will need to be known.  Or in this case, two numbers will need to be obtained.  All of them have been specified already in this post.  We will need an "area" and a "height" to determine the total volume.  What's missing then?


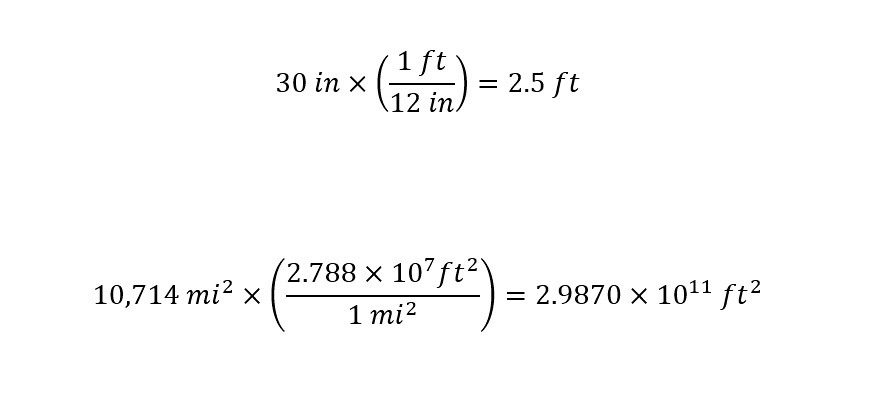
The values are all reported in different units.  What?  Yes, we have an area of Haiti that is reported as 10,714-square miles.  Further, we have a height of rain that has or is estimated to fall to be 30 inches.  In order to compare and calculate, the units have to be uniform.  In this case, lets choose units of feet.  Our total volume will be reported in cubic feet of rain.


To convert the reported values, we will need the conversion factors from inches to feet and from square miles to square feet.  From the previous blog on rainfall in China, the value is listed below in the conversion shown below:


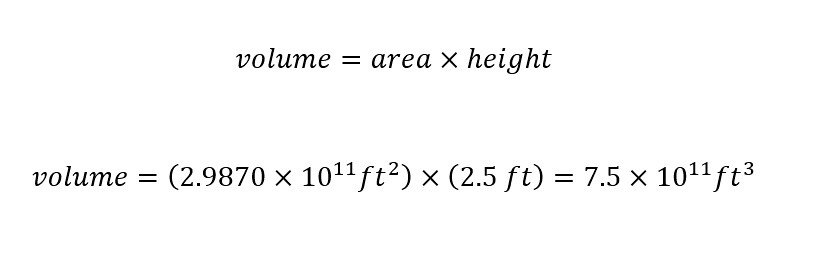
Next, the equation for the volume is equal to the area (geographic area) multiplied by the height of the rainfall.  The equation for volume is shown below with the above values filled in appropriately:


Wow!  What does the above result mean?


How Does The Value Compare To Other Recent Storms?


As I mentioned earlier, I wrote a blog post on the torrential rain fall in China a few months ago.  Turns out that 12 provinces received around a couple of feet of rain over a geographical area of 10,000 square miles.  Wow!  The total cubic feet of rain was 580 billion cubic feet.


According to our calculations above, the total rain fall expected to hit Haiti as a result of Hurricane Matthews is 750 billion cubic feet of rain.  That is nearly 1.3 times the amount of rain that hit China earlier this year.  These two storms are huge in comparison to the four other storms that I have wrote blogs about: Maryland (USA), Louisiana (USA), Mexico, and Macedonia.


Still, the fact that Haiti is receiving so much rain over its entire land mass is life threatening.  More so than in China, although the populations and land masses are quite different.  Nonetheless, we should be sending humanitarian aid to the victims of these terrible storms.  By calculating the amount of rain fall each storm drops on a given geographic area, the realization of the threat becomes more real.  Dimensional analysis allows us to visualize the magnitude of such disasters by comparing them to our own geographic area.


How does the geographic area of Haiti relate to the geographic area that you live in?


Think about the magnitude of this devastating event.  How would you be impacted by the same volume of rain?  Remember, the magnitudes and values reported/calculated above, neglect the wind speed of 145 miles per hour that blew across the region.  That speed of wind would produce and life threatening force that would level houses and buildings (if not properly built).


Until next time, have a good night.

Monday, August 15, 2016

How Much Rainfall Has Dropped On Louisiana?

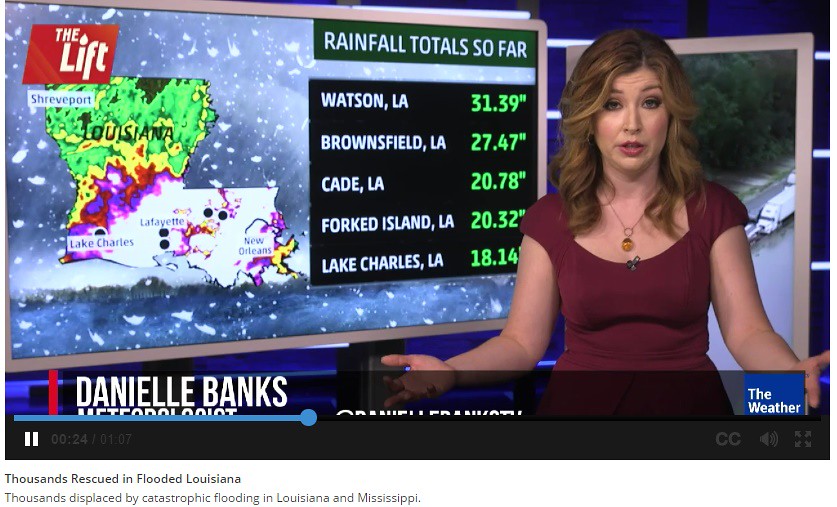
In certain parts of the state of Louisiana, there have been reports of up to 30 inches of rainfall.  Here is a still photo taken from a broadcast on the website 'Weather.com' shown below:


In the picture above, the heaviest hit city is Watson with 31.39 inches of rain while the least hit city is still covered in 18.14 inches of rain.  Quite a distribution of volume over a large region.  Couple the distribution of rainfall shown above to the video taken from the news website 'NBC' titled "Louisiana Flood Displaces Thousands" shown below (less than a minute in length):


How do viewers process the destruction that is caused by such heavy rainfall?


Below are a few calculations to determine the extent of volume of rainfall hit in certain parts of Louisiana.  By understanding the magnitude of rainfall in certain regions, a perspective can be drawn to understand the tragic amount of rain that has hit the state and displaced thousands of residents.


How Large Is Livingston Parish Louisiana?


Recently, an enormous amount of rainfall has fallen in various parts of the world in the last month.  On this blog site, I have covered a few with calculations to provide a perspective: China, Mexico, Macedonia, and Elliot City (Maryland, USA).  Along the same line of reasoning, the amount of water should be determined that fell on the geographic region -- Livingston Parish, Louisiana.  With a volume of rainfall calculated, a direct comparison with other storms could be possible.


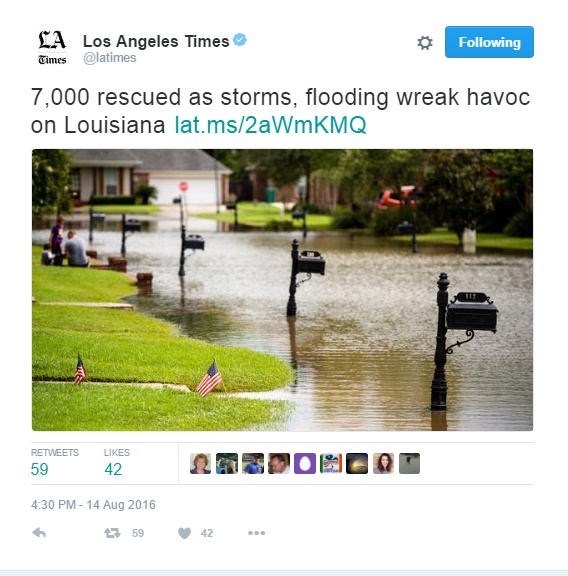
Here is a picture from the 'Twitter' account of the news site ''Los Angeles Times" shown below:


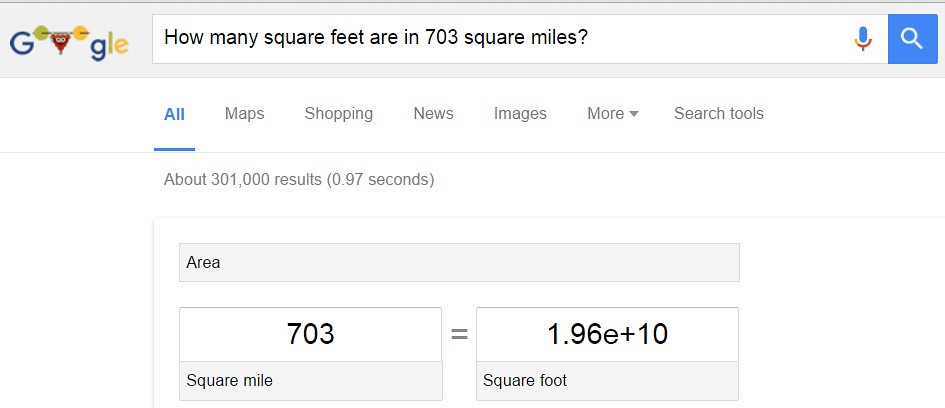
7000 people displaced?  Oh my goodness.  The amount of water must be significant.  In order to calculate the volume of water, the dimensions of the geographic region of Livingston must be determined.  Following along the same methodology of past posts on this site, let's ask Google.com.  Here is the results shown below:


How about square feet?


Just by inspection of the magnitude of square feet -- 19.6 billion square feet -- immediately, you can reason that this storm is going to be large in comparison to previous storms mentioned.  Not to mention the video shown above.  With the area of Livingston expressed in square feet, the volume of rainfall can be calculated according to the expression shown below:


But wait, the reported amount of rain in Livingston was 21 inches of rain.  How many feet is that?  Just divide 21 inches/(12 inches/ft) = 1.75 ft.  With the height now expressed in feet = 1.75 ft, the volume can be calculated as follows:


Wow!  34.3 billion cubic feet of water?  No wonder the news accounts show cars floating down the streets in certain parts of the state.  As usual, the number becomes a reality when expressed as a integer of a metric.  Based on the past blog posts written about floods along with the enormity of the number above, the Mercedez Benz Superdome should suffice as a metric.


How Many Superdomes Could Be Filled With Rainfall?


The Superdome is shown below:


Source: Nwill21


How many Superdomes could be filled with 34.3 billion cubic feet of water?


In order to directly compare the volume of the Superdome to the volume of rainfall, the Superdome volume needs to be known.  The volume taken from the 'Wikipedia' site is listed at 37 million cubic feet of interior volume.  Now, that we have two numbers expressed in the same units (cubic feet), a simple division of the two numbers will yield the number of Superdomes which could be filled as shown below:


Oh my.  The results of the calculations indicate that the total number of Superdomes which could be filled with the volume of rainfall = 34.3 billion cubic feet would be 274 Superdomes.  Naturally, the number is large with such a enormous value of cubic feet of rain.  In case you (the reader) view large volumes in units of gallons with a better perspective, the conversion of units from 'cubic feet' to 'gallons' is shown below:


The total number of gallons of rainfall in the region of Livingston Parish over the course of a few days is equivalent to 256 billion gallons.  Amazing.  Again, how much water is in the sky?  Looking at this large number, a person has to view the atmosphere above them in a different light.  How much more water is in the air in 'humid' conditions?


To put the volume of rain into perspective, a direct comparison can be made with other storms.  Here are the following storms with the number of Superdomes in parentheses: China (4,640), Huauchinango Mexico (6.7), Macedonia(82), and Elliot City-Maryland-USA(56).


Conclusion...


Looking at volume alone for the storm that has hit Louisiana is astonishing.  Next, directly comparing the number of Superdomes which could be filled provides a perspective of volume that is still difficult to grasp.  I have trouble visualizing 274 Superdomes.  Although, casting the volume in comparison to other recent storms helps slightly.  That, of course, is a relative comparison.


Forecasting the amount of rain is a relative number too.  But through the calculations shown above, the reader can gain a better perspective to match to the tragedy that is shown in the video above.  It is difficult to imagine a car floating down the street or a boat rescuing people from their houses.  Although, when you think of the volume of 274 Superdomes releasing all of the water contained in them and spreading that water over the area, the pictures from news accounts a cast into a perspective.  Until next time, have a great day!


Monday, August 8, 2016

How Much Rain Did Huauchinango (Mexico) receive?

Hurricane Earl ripped through the mountainous region of Mexico dropping a large amount of rain across an inclined terrain.  How much rain did the town of Huauchinango receive to impart such deadly results?  Below are the results that have thus far contributed to the unfortunate deaths of 39 innocent people.


How Large Is Huauchinango?


In order to understand the devastating impact that rain can have across a given region, there are parameters that need to be known: population, size of city, and amount of rainfall.  When rainfall imparts itself on a given region, the volume is usually the most critical aspect aside from the infrastructure in place by the city officials.


Unfortunately, when the rainfall is accompanied by thrashing winds with speeds in the tens to hundreds of miles per hour, then the destruction is amplified.  These events are tragic and leave a lasting disastrous effect on a region.  Let us hope that the destruction is minimized as much as possible.


According to a twitter post shown below, Hurricane Earl has already taken 39 lives and caused major flooding across Mexico.


Upon clicking on the story, the reader is directed to the website "CBS.com" to the story titled "Tropical Storm Javier forms off Mexico as Hurricane Earl death toll rises" that provided further details regarding the destructive effects of Hurricane Earl -- which include the tropical storm Javier.  Here is an excerpt describing the rain fall:


At least 28 people died in multiple mudslides in the mountainous north of Puebla state, National Civil Protection Coordinator Luis Felipe Puente said in an interview with ForoTV. He said 25 of the dead were in various parts of the township of Huaucinango and three were in Tlaola.

Rains also set off mudslides in the Gulf coast state of Veracruz that killed 10 people, officials reported. Gov. Javier Duarte said the landslides were in the towns of Cocomatepec, Tequila and Huayacocotla.

Heavy rain continued in the area, leading officials to close a section of the main federal highway connecting Mexico City to the region. Crews spent the day clearing a number of landslides from the road, but authorities said mud was continuing to slide with the new rain.


The website went on to report rainfall between 4-8 inches of rain with winds up to 45 miles per hour.  In order to get a grasp on the amount of rainfall that dropped onto the mountainous region, a few calculations need to be done.  I have to admit that I have been busy over the last couple of weeks writing similar blog posts.  The disaster due to irregular climate has caused an enormous amount of rain to fall in different regions of the world.


Over the last month, two blog posts have been written about heavy rainfall in different regions -- China and last weekend -- Elliot City (Maryland, USA).  Click on the links to read about the respective rainfall in those regions.  Additionally, I was planning on writing about India last week, but was too busy.


What is going on with the weather lately?


Too much rainfall and destruction.


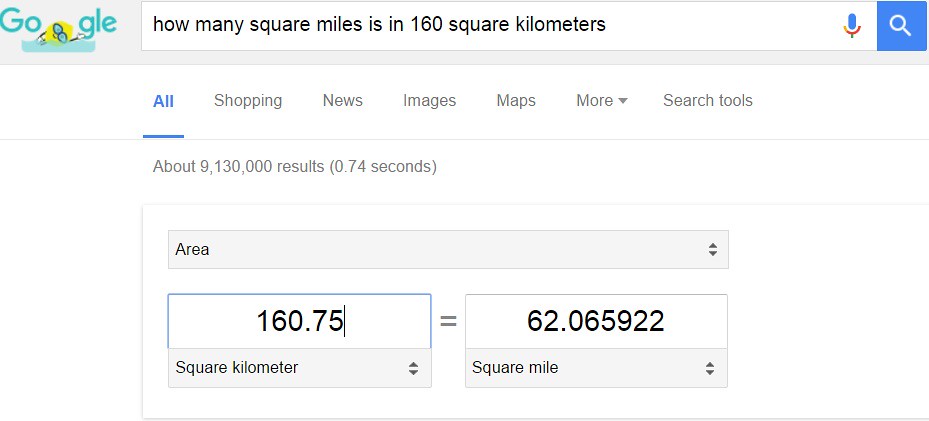
In order to start the calculations -- which are similar in methodology, the size of the city (region) of Huauchinango needs to be known.  According to the "Wikipedia" page for Huauchinango, the size of the region is roughly 160 square kilometers.  Lets take a short cut and ask Google.com to convert square kilometers into square miles to save us one step as shown below in the image:


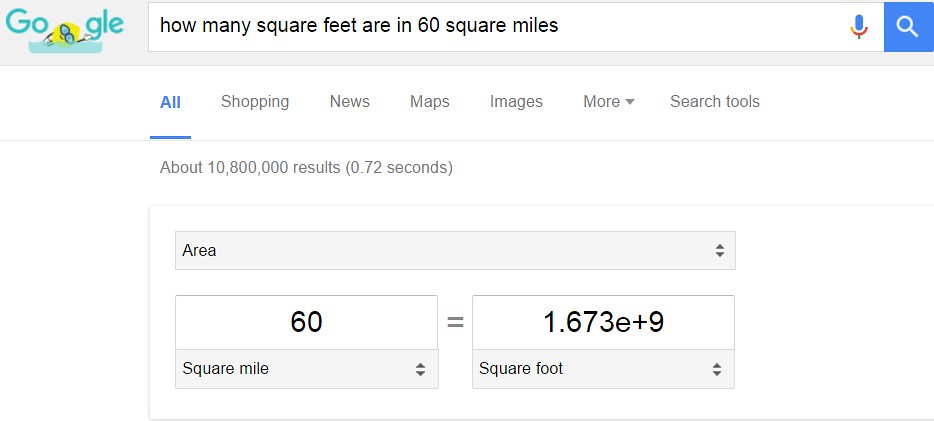
Next, in order to determine the volume of rain that poured down in the city, another conversion of units is necessary.  The conversion from square miles to square feet needs to be done.  Of course, Google.com seems to be a good search inquiry to use (since I am being lazy at the moment).  Below is an image of the conversion factor:


I must point out a slight mistake.  In the first image of the conversion factor from square kilometers to square miles, the number of square miles is equal to 62 sq. miles.  On the next image, I transferred over the wrong number -- slightly less to 60 square miles.  Although, since the point of the post is to approximate a value, I think that I can let this mistake slide.  Forgive me.


According to the news account, the amount of rain that fell was between 4-8 inches.  For the purposes of getting a rough idea, I will use the average of the two numbers -- 6 inches.  In order to calculate the volume of rain, an equation is needed which is shown below:


In the expression (or equation) above for the volume of rain, there are two parameters.  The first is an area -- which has been determined to be 1.67 billion cubic feet of water over an area of 60 square miles.  Whereas the second parameter needed to determine the volume is the height.  The number chosen out of the range was 6 inches of rain  -- which is equal to 0.5 feet.  If we plug those numbers into the expression above, the equation is shown below:


The answer is in scientific notation.  Basically, the total volume rain that fell over an area of 60 square miles is equal to 836 million cubic feet.  Oh my.  Add to that calculation winds approaching 45 miles per hour and destruction is easily seen.  What a terrible situation?


As usual, these large numbers are too astronomical for me to wrap my head around.  Therefore, usually, I try to think of a metric (a known volume) that I can use to cast the result into for me to visualize.  Below are the results of that analysis.


How Many Olympic Size Pools Could Be Filled?


Naturally, when such a large number (actually an enormous number) is the result of a calculation, further dimensional analysis is needed to put the volume into perspective.  What type of metric is appropriate for the volume?  The number is huge.  In order to find a proper metric, a couple of guesses need to be made.


To start with, since the world is fascinated by the Olympics and the world teams competing in the summer events, how about using the Olympic Size Swimming Pool as a metric?


In order to do so, the volume of an average Olympic Size Swimming Pool needs to be known.  Recently, the volume of the pool has been used in another blog post where large volumes of  liquid was the center subject of the post.  A couple of weeks ago, I wrote a post regarding a sewage spill that dumped nearly 2.4 million gallons into the Los Angeles River.  In that post, the metric of a Olympic Size Swimming pool was used to cast the large volume into perspective.  According to that post, the volume of water needed to occupy an Olympic Size Swimming pool is 660,000-gallons.  A picture of an Olympic Size Swimming pool is shown below taken from the "Wikipedia" page:


Source: Ahl Baku


For those readers who have been engaged in watching the games at Rio -- does this look familiar?  As I mentioned the total volume is 660,000-gallons in total to fill up an Olympic Size Swimming pool.  Since, the volume of the total amount of rainfall is known from the calculations above, the two numbers simply are divided by one another.


But wait -- the units are not the same....the Olympic Size Swimming Pool is expressed in units of gallons.  Whereas the volume of rainfall is expressed in units of cubic feet.  In order to perform a direct comparison, a conversion into the same units is needed.  The volume of rainfall is converted into units of gallons as shown below:


Now, with the units both expressed in gallons of the two volumes (Olympic Pool and Rainfall), the two numbers can be divided by each other to yield the number of Olympic Size Swimming pools that could be filled with the total rainfall that the city of Huauchinango experienced over the weekend.  The calculation is shown below:


Wow!  The total amount of rainfall that the city of Huauchinango experienced over the weekend would fill 9,484 Olympic Size Swimming pools -- Wow!


Can you really wrap your head around this?


I have trouble visualizing that amount of swimming pools.


How about using a larger space as a metric?


Mercedez Benz Superdome?


In the past blog posts, a larger volume that has proved handy when enormous numbers are the result of calculations, is the Mercedez Benz Superdome (located in Louisiana) and is shown below:


Source: Wikipedia


Since the volume is extremely large as indicated by the number of Olympic Size Swimming pools, a larger volume is needed to use in carrying out dimensional analysis of the storm in Mexico.  According to the "Wikipedia" page, the interior space (volume) of the superdome is approximated to be around 125,000,000 cubic feet.   In the initial calculation of the volume of rainfall, the answer was expressed in units of cubic feet.  With the values expressed in the same units, a simple division is needed as shown below to determine how many superdome's could be filled:


That is still a large number of superdomes to imagine.  According to the calculation, nearly 7 superdomes could be filled with the total amount of water that fell on 60 square miles in Huauchinango over the weekend.  Wow!


Add into the result the 45 mile per hour wind and the destruction is clearly understandable.  On top of all of this, the region sits on a slope of a hill.  An additional factor of gravity sending the rainfall down a slope would give the storm additional power (destructive power).


Conclusion...


After calculating the total volume of rainfall that Huauchinango received over the weekend, the amount of destruction is more understandable.  Still, the destruction which includes the loss of life is never really understandable.  Storms like tropical storm Javier remind us of the sheer power of nature and that we are a very small part of a larger world.  Additionally, the importance of having the proper infrastructure (buildings, disaster plans, government, etc.) to help out is of the most critical importance.


Looking a the numbers as a result of the calculations.  9,484 Olympic Swimming Pools, nearly 7 Mercedez Benz Superdomes -- these volumes are not trivial or small.  As you watch the games try to imagine the volumes and their relation to the natural disaster.


In the near future, I will write a summarized post of the recent rainstorms that have hit the world and their relative values.  Until next time, have a great day!


Monday, July 25, 2016

Can A Broken Sewer Line 20 Miles Away Close The Beach?

Can a broken sewer line 20 miles away cause a beach to close down for a couple of days?  Actually, yes.  Surprisingly enough, when 2.4 million gallons of sewage is spilled onto the street near downtown Los Angeles, a beach that is 20 miles away could be impacted.  In fact, especially if there is a direct route to the beach like the Los Angeles River.  A large amount of press was devoted to the story earlier this week.  There was question to the degree of harm possible and the impact on the tourist visiting the beach.  After reading this, I could not help but ask the following question:


How much sewage is in 2.4 million gallons? 


In the paragraphs below, we explore through dimensional analysis the volume reported in the news.


How Large Is 2.4 Million Gallons?


In order to understand the magnitude of the disaster and the threat to the surrounding community, we need to understand how large of a volume is 2.4 million gallons of sewage.  More generally speaking, how does one visualize 2.4 million gallons of a liquid (say water for example)?  


In order to visualize the volume, another volume must be used as a metric.  That is how dimensional analysis is carried out for other blog posts on this blog and in science, engineering, math, etc.  A metric is used to cast the volume in question into for a comparison.  For a volume of this magnitude, an Olympic Swimming Pool is a convenient choice.  


How do I know this to be a suitable metric to use for dimensional analysis of the sewage spill?  


Based on previous blog posts in which we entertain a range of volumes (small, medium, large) of a liquid (water, oil, etc.), the volume of the swimming pool will be a suitable metric.  If you are a reader of this blog, you would agree.


How large is an Olympic Swimming Pool?


A picture of an Olympic Swimming pool is shown below:


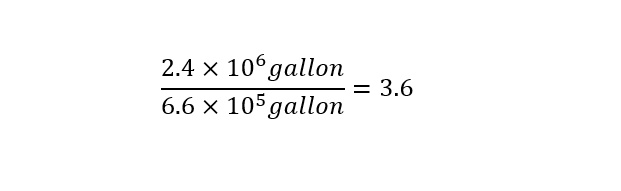
The volume of an Olympic Swimming pool can be taken from an earlier post that I wrote on this site: the introductory post!  The volume is around 660,000 gallons of water.  With this value in hand, the comparison to the volume in question (2.4 million gallons of sewage) is straightforward as shown below:


This means that 3.6 Olympic Swimming pools could be filled with the total amount of sewage spilled.  When the volume is cast into that light (or dimension), the amount spilled does not seem excessive.  Why were the beaches closed?


Beach Closure Due To Sewage Spill


The news reported a disaster in the form of a broken sewage pipe that spilled 2.4 million gallons of sewage into the streets of Los Angeles.  Here is a video of the news report from the YouTube channel for "CBS news" shown below:


Source: CBS News


After watching the video above, the one question dominating my mind was the following:


How did toxic levels accumulate in the ocean after spreading out down the LA River bed?


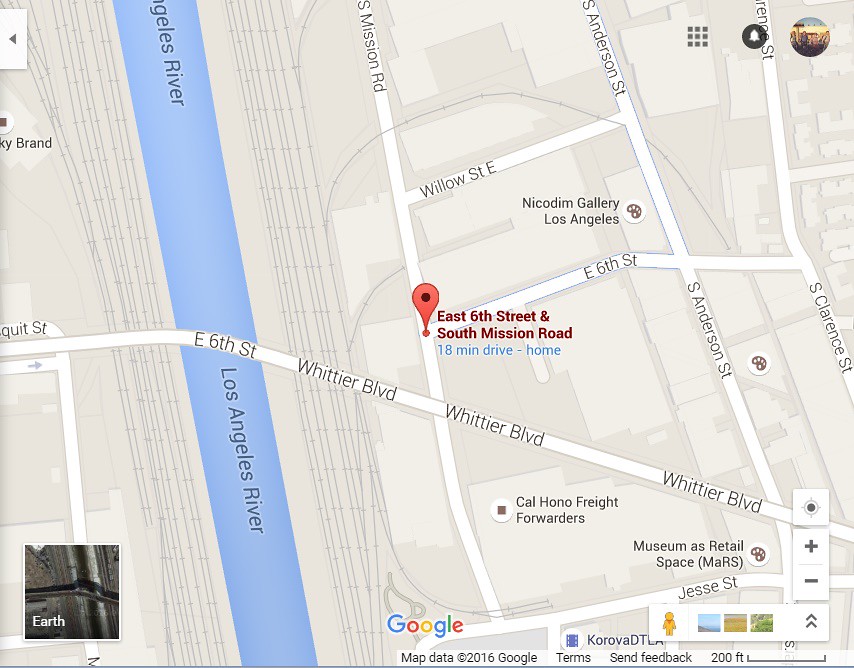
Here is a map showing the distance to the LA River:


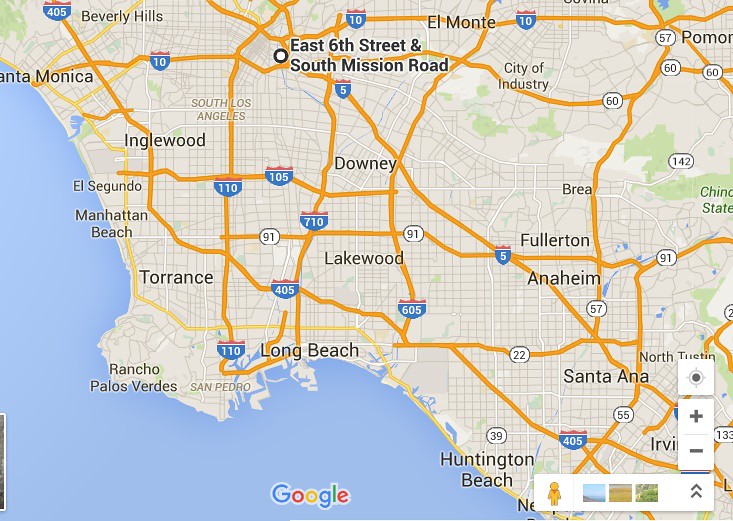
On the lower right hand corner of the map, a scale is provided to give context to the distance from the spill to the river.  Furthermore, if we zoom out and look at the distance to the ocean, we can barely see the LA River as shown in the map below:


Why is this relevant?


The river bed is not full of water at any given time as portrayed in the GoogleMap above (the first map).  In the video above, the river is shown filled side to side (near the ocean).  That portion is closer to where the river dumps into the ocean.  This is due to the ocean creeping back up into the river bed with a back pressure.  Further up a few miles, the water is narrower.  According to the news report, the spill occurred 20 miles up the river from the ocean.  This time of year, the river is around 10 feet wide and about 2 feet deep.


The question that should stand out in everyone's mind is how much sewage is required to reach the ocean?


The reasoning behind the thought is the following.  Upon the pipe breaking, sewage starts to spill and eventually runs into the river.  By the time the initial sewage reaches the ocean, there should be a dilution due to mixing with the existing water.


How much water is flowing from the spill site to the ocean?


Below is a map illustrating the distance from the spill site to the ocean:


The path along the river to the ocean is denoted by the "blue line" in the map above.  A scale is shown on the lower right hand side of the map.  In total, the distance is 22 miles to the ocean.


If we want to determine the volume of water in the river, a volume needs to be calculated.  The equation for volume is shown below:


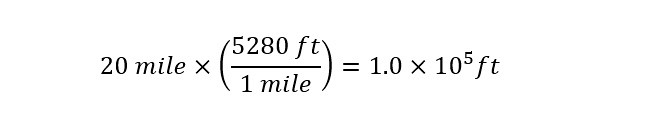
In the equation above, there are three parameters that need to be known in order to determine the volume of sewage.  First, the length is known to be 20 miles from the spill site to the ocean.  Second, the width is approximated to be 10 feet.  And last is the height of the water which was approximated to be 2 feet.  The volume can be determined using the values listed as follows:


The volume can now be determined using the equation above for volume as follows:


The volume calculated above is expressed in units of 'cubic feet' which is not useful to compare against 2.4 million gallons.  In order to convert units from 'cubic feet' to 'gallons' the conversion factor needs to be known.  For every 'cubic feet' there are 7.4805 gallons.  I took this conversion factor from a previous blog post.


With conversion factor between units known, the number of gallons can now be determined as follows:


The volume is now expressed in units of gallons -- which will allow us to perform a direct comparison to the volume of the spill shown below:


What does the result of 6.7 mean from the calculation above?


As the sewage spilled into the LA River, the sewage was 'diluted' into a large volume of water.  I would like to know when the concentration of sewage was near zero in the river.  I would speculate that the river and beaches were open before that was the case.


In an article in the 'LA Times' titled "Sewage spill in L.A. grows to 2.4 million gallons, prompting bans on swimming in Seal Beach and Long Beach", there was an excerpt detailing of a large sewage spill that occurred during the storm 'El Nino' in 1998.   Here is the excerpt shown below detailing the extent of the beach closure:


Although the leak was large, it pales in comparison with Los Angeles’ largest spill.
In 1998, more than 30 million gallons of sewage spilled during El Niño storms, Hagekhalil said.
“We haven't had a large overflow in over 15 years,” he said.


If there was no storm to push the sewage down the river, how long does the sewage take to disperse?


Solid sediments inside the sewage flowing over a distance of 20 miles will invariably settle on the bottom of the river bed.  Additionally, this would cause the overall concentration of harmful bacteria to drop in a short period of time.  Although, as more water flows down the river, the sediment that settled would get kicked up and redistributed -- down the river.  This question begs a couple of other questions regarding the homeless population that live along the river bed:


How were the homeless people who live along the LA River impacted by the sewage spill?


Why was there no reporting of the impact on the residents along the river bed?


If you have bicycled down the LA River trail to Long Beach, you have inevitably seen the unusually large homeless population.  Each time that a storm hits, the 'LA Times' will run a story documenting the concern for the homeless living along the river (news from Mayor).


Were these people not impacted by the sewage spill?


Regardless, the sewage spill is a major problem and typically under reported.  Although, the same type of reporting is done regarding oil spills in the past locally.  These are just a few initial thoughts on the matter.  Stay tuned as more spills emerge.


Conclusion...


There are many remaining questions that have not been answered by the popular news over this disaster. What actions have been taken to reduce a future occurrence like this? In the LA region, there seems to be a large number of water and sewage pipes that are outdated and need to be fixed. How does the City plan to fix these potential problems? What about the homeless population living in the LA River? How were they impacted during this event?


More information needs to be disseminated about the acceptable level of bacteria or toxins that the City uses to decide upon when to re-open the beaches and Rivers. There are tourists and residents that would like to know this information. What procedures are used to determine safety of the water? I would like to know the methods as an instrument manager at a University chemistry department. Additionally, I am sure that the chemistry students who are interested in pursuing careers in the environmental testing sector would be interested in knowing too.


Monday, July 18, 2016

How Much Rain Did China Really Receive?

A recent news story broke about flooding in China due to a torrential rainstorm recently.  This rain has caused considerable damage and destruction both to buildings and structures along with the loss of life.  In order to truly understand the meaning of the picture below, I thought that a short blog post using dimensional analysis to compare to recent water stories hitting the news this year would be appropriate.  Here is the picture of a stadium in China taken from a news story:


Source: Quartz


How does this picture compare with others describing disasters earlier in 2016 thus far?


The following will be a series of calculations illustrating the numbers relative to earlier numbers reported in earlier blog posts on the site.


Torrential Flooding In China


In a recent video displayed on the website of the 'New York Times,' titled "Flood Ravages Southern China" -- the extent of the flooding is clearly visible.  The video is short (less than a minute) and worth watching:


Where did all of this water come from?  Obviously the sky, but why in periodic downpours?


At first, I thought that China along with the rest of the world needs the water that is possible due to nature.  There is a limit to the need, where, need turns into excess with improper construction that ends in disaster.  This is extremely unfortunate.  From a viewer's standpoint -- thousands of miles away, the amount of water contain in one or two feet of water seems inconsequential.


Although, according to the news site 'InsuranceJournal' in an article titled 'China Floods Kill 173, Cut Transportation Links; Hit to Economy Expected,' the total amount of water was distributed over a large land mass area.  Here is an excerpt describing the rain and destruction:


The Ministry of Civil Affairs said flooding and rain associated with the typhoon affected more than 31 million people in 12 provinces, submerged more than 2.7 million hectares (6.7 million acres) of cropland and caused 67.1 billion yuan ($10 billion) in damages.


That is a large amount of water to drop from the sky.  The damages are enormous at least in number along with the huge number of people adversely affected (31 million over 12 provinces).  Descriptions of events differ greatly depending on the sources.  Coming from a journal whose audience is mainly from the insurance sector, crop damage would be of great importance.  At the same time, reporting on the effect on the GDP would be appropriate out of a journal of this sector.  Here is a description taken from the article describing the negative impact on the GDP as a function of flooding below:


China’s National Development and Reform Commission said in a statement Sunday that fruit and vegetable prices had “risen significantly” in some flooded regions. It asked local authorities to “closely monitor prices” and implement price controls if needed.

Flooding will boost consumer prices in July and August by about 0.2 percentage point to levels above 2 percent, Zhou Jingtong, director of macroeconomic research at Bank of China Ltd. in Beijing, wrote in a note. The CPI rose 1.9 percent from a year earlier in June, less than a 2 percent gain in May, the National Bureau of Statistics said Sunday.

Economists said the floods would have both short- and long-term implications for the world’s second-largest economy. Food and product shortages could materialize soon from supply interruptions as transport hubs were paralyzed and factories and offices closed in some of China’s most industrialized provinces.


Economists suggest that the effect is unknown and will show itself in later quarters the year in terms of GDP.  For the purposes of this blog site, I am concerned with understanding the dimensions of the reported statistics.  Therefore, after reading about the enormous amount of rain,  I wondered how much water was in that reported volume?


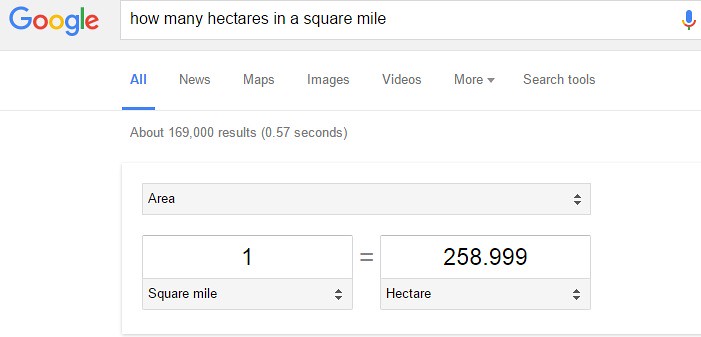
I decided to carryout a few calculations below.  I will walk you through my calculations of the water below.  In order decided to compute the amount of water in the volume described above -- 2.7 million hectares and 2 foot deep, the conversion of how many hectares are in a square mile has to be obtained.  Typically, the volumes of water that are reported in the popular news are cast in units of "cubic feet" -- therefore, to get to cubic feet, we will have to go through square miles.  First, the conversion from hectares to square miles is shown below:


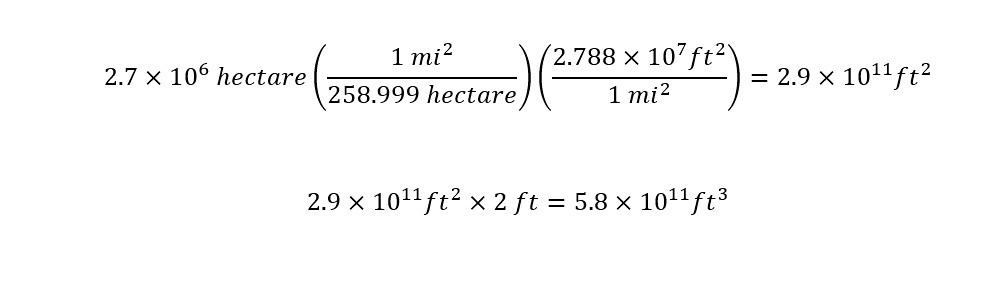
With the conversion factor known, the dimensional analysis of hectares to square miles is possible as shown below:


The first line of the calculations above is the conversion of hectares into square feet.  Since the objective was to eventually calculate a volume for a meaningful comparison, the calculation includes the conversion from square miles into square feet.  In the second line of the calculation, the area of the water is expressed in square feet is multiplied by the value "2 ft" (which represents the height of the rainfall).  The calculated value is in units of cubic feet which is a volume.  What does the number above represent?


The calculated number -- 580 billion cubic feet represents the total rainfall (a volume) that fell on 2.7 million hectares of land in China -- WOW!!!!


How Large Is 580 Billion Cubic Feet?


In order to put that volume into context, we need to return to an old post (back in January) titled "How Much Water Is In A Few Inches Of Rain?" where I verified a statistic (volume of rain) that was reported by the popular news.  Through researching where the 'error' propagated from, I determined that the weather forecasting service center made a "late night" calculation error.  At least, that was the response from the service that I received.  Read that blog to find out more about that fiasco.


The result from the calculations in that blog post resulted in our understanding that over the range of the Lake, 1.92 inches of rain equated to around 6.3 billion gallons of water.  Therefore, we should not be too surprised with the result above.  Still, the amount of damage is terrible and should not be minimized in any manner.  Remember, on this site, we are dealing strictly with the numbers (or facts) that are reported in the popular news.


How many hectares encompass the Lake Tahoe area?


Great question.  According to 'Wikipedia' -- the Lake Tahoe Watershed -- which consists of the mountain area surrounding Lake Tahoe and which drains into the lake is around 505 square miles.


How many 'hectares' are in 505 square miles?


To start the calculation, we need to know the conversion factor between the two areas.  The conversion is shown as an image below:


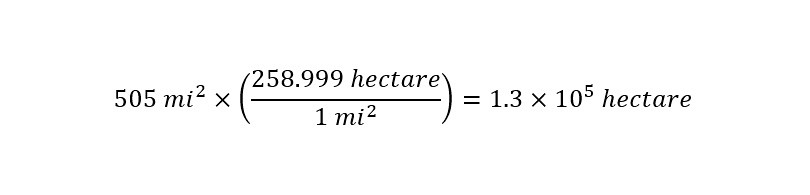
Next, how many are in 505 square miles?  Easy, just multiply 505 square miles by 258.999 hectares/square-miles as shown below:


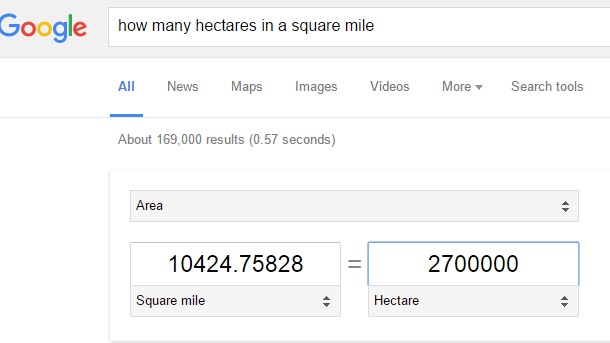
How does 130,000 hectares compare with the reported 2.7 million above?  Here is the image of the conversion online shown below:


The Lake Tahoe watershed basin is 1/20th of the size of the 12 provinces in China that were submerged in water.  Plus, the amount of rain fall differed in the two storms by nearly 22 inches of rain -- which is a considerable (enormous) amount water.


In order to compare the amount of rain that poured down in the two regions -- Lake Tahoe and China, the volume needs to be expressed in units of "gallons."  The conversion of the volume in units is shown below:


With the volume expressed in units of gallons, a direct comparison to the volume of rain discussed in my previous blog about the rainfall in Lake Tahoe is now possible.  Dividing the two numbers yields 676 as shown below:


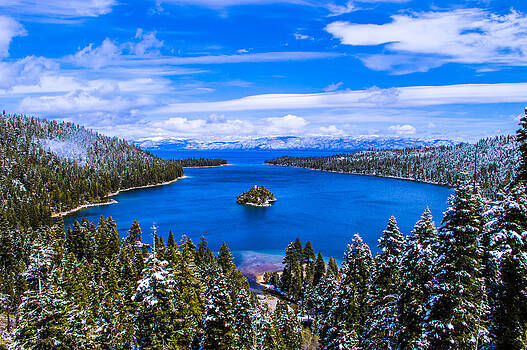
Below is a picture of the Lake Tahoe basin:


What does the ratio -- 676 mean?  The question can be restated to the following:


What is the equivalent volume per area for Lake Tahoe?


Equivalent Volume Per Area For Lake Tahoe?


At the end of the last section the question of equivalent volume per area was in question.  Which is to say, the amount of the rain that fell over 12 provinces in China over 2.7 million hectares is 2 feet.  Now the question is:


How many feet of rain in the Lake Tahoe region would compare to the volume in China?


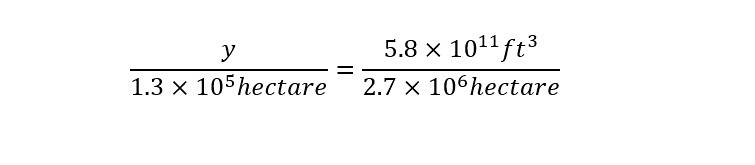
To start with, a statement of equivalent ratio of feet to volume needs to be stated as shown below:


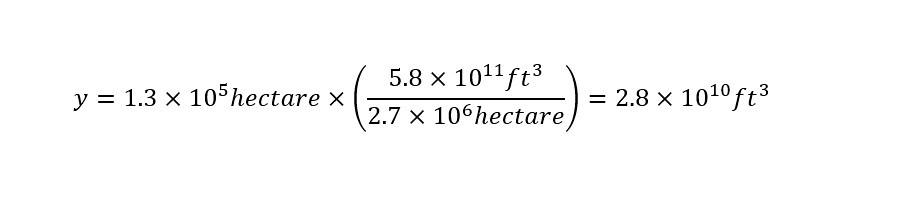
On the left hand side, there is a variable "y" in the numerator which represents the volume (yet to be determined) of the equivalent rain covering Lake Tahoe to that of China.  In the denominator, the area of the Lake Tahoe region (Lake and surrounding mountains) is expressed in hectares.


On the right hand side, in the denominator, the volume of rain (580 billion cubic feet) that fell on China is shown divided by the area -- which is 2.7 million hectares.  After rearranging the equation to solve for "y", the result is shown:


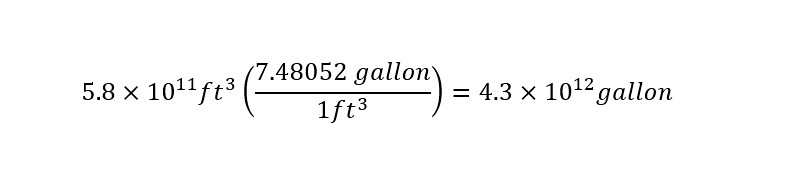
In order to compare the volume of water that fell as rainfall to the volume reported for Lake Tahoe last winter, the units of volume need to be the same -- gallons.  Shown below is the conversion from cubic feet to gallons:


Next, dividing the two volumes (China and Lake Tahoe) of rain fall will yield the multiplication factor.  The ratio can be determined below as shown:


The ratio of the two volumes of rainfall is 33.  Which means that the volume of the initial rainfall from last winter in Lake Tahoe can be used to determine the equivalent rainfall that occurred in China.  First, take the multiplication factor and determine the amount of inches as shown below:


One final conversion from inches to feet will yield the equivalent amount of rainfall in the Lake Tahoe basin as shown below:


That is an enormous amount of rain.  Clearly, one can look at the picture of Lake Tahoe above and imagine 25 feet high of rainfall as incomprehensible.  Further, to imagine that the calculated volume was spread over 12 provinces in China.  No wonder there was such a large loss in crops and infrastructure.  What a terrible disaster?  Volumes of water like this make me wonder just how much water is in the sky?  Must be a truly incomprehensible amount.


Conclusion and Homework


The point has been driven home regarding the natural disaster experienced by China over the last couple of weeks.  An enormous amount of torrential rainfall has poured down and disrupted not one city but multiple provinces.  The damage for which has yet to be truly determined and might take a while seeing the scale on which the disaster occurred.


The calculations revealed an astounding volume of 25 feet pouring into the Lake Tahoe region to be compared to the entire storm in China.  Unimaginable to say the least.  For the reader (you), I have a couple of problems for a "homework assignment" listed below based on former blogs on this site:


1) How does the volume of rainfall compare to the volume of water stored in the Mosul Dam in Iraq?


2) How does the volume of rainfall compare to the flood in Brazil late last year from a mine?


3) How many Deep Water Horizon Oil Spills is the volume of rainfall equivalent to?


4) How many of the "World's largest pool" could be filled up with the volume of rainfall?


I think that the assignment will span the full range of volumes and give you an idea of the enormity of this natural disaster.  I hope that you will view disasters like this in a completely different light after working through the problems on the blog and the site.  Have a great day!