Monday, August 8, 2016

How Big Was The "Water Bomb" Of Rainfall In Macedonia?

Lately, water is falling like crazy out of the sky in various  parts of the world.  If you are a regular reader of this blog site, you will remember the torrential rainfall in China a couple of weeks ago, followed by Elliot City (Maryland, USA) the weekend before last.  Continuing on, the storm season has hit India and last weekend parts of Mexico (city of Huaunchinango).  Click on highlighted regions to  be directed to their respective blog posts filled with calculations of their respective rainfall.  What is going on in the world with the excessive rainfall?  Seems like each time I check social media, another disaster has struck the world and wreaked havoc.  Recently, I found out about a torrential storm in Macedonia that hit parts with rainfall described as a "water bomb".  Below are the calculations to provide you with perspective using metrics as to the scale and size of these tragedies.


How Large Is Skopje?


According to the news site "ABC.com", the capital of Macedonia -- Skopje received an enormous amount of rainfall over the last few days.  Here is the picture taken from Twitter to describe the story:


Upon clicking the link, the story titled "Macedonian Flash Floods Leave At Least 22 Dead, 4 Missing" contains catastrophic volumes of rainfall reported.  Here is an excerpt describing the tragedy that has hit the country:


Nearly two dozen people were killed and dozens more were injured when torrential rains triggered flash floods in the capital of Macedonia, the Red Cross said Sunday.

Government spokesman Aleksandar Gjorgiev told The Associated Press a state of emergency had been declared for two weeks in the most affected areas, which included the capital of Skopje, the city of Tetovo and surrounding suburbs.

The Red Cross reported that 22 people were killed, more than 60 people were injured and four were still missing after the floods destroyed hundreds of homes and wiped out electricity. More than 1,000 people were evacuated from their houses, according to the Red Cross.


Any loss of life is tragic and unfortunate.  The article goes onto report a total of 20 inches falling in parts of the city of Skopje.  That seems like a large amount of rain, but the size of the region should be known in order to put the volume of rain into perspective.  If "Wikipedia" is consulted, the city of Skopje is reported to be around 220.64 square miles in size.  Wow.  Considering the size of the rainfall the disaster due to the volume of rainfall is slowly coming into perspective.


Why do I say this?  


If you have followed the previous calculations, these numbers will add up to an enormous volume.


Recent floods in regions like China and Mexico have produced extraordinary volumes of rainfall that have caused considerable damage.  Although, in China, the rainfall was spread out over a larger geographical area -- which resulted in a larger amount of damage to the country's overall GDP.


In order to really compare the volumes, a few calculations need to be carried out.   Typically, I like to calculate the total volume of rainfall in cubic feet. The reason I choose to express the total volume in in cubic feet is that the height can easily be calculated from inches.  Furthermore, having he volume expressed in units of gallons expands the direct comparisons that are possible -- since the majority of volumes that are reported in the news are either reported in units of 'gallons' or 'cubic feet.'


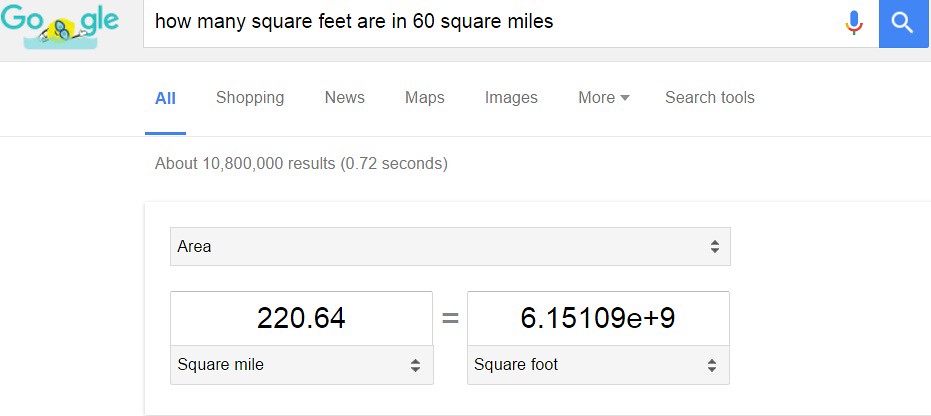
With that in mind, the area of Skopje which is expressed in units of 'square miles' needs to be converted to 'square feet.'  I decided to use Google.com to convert for me.  This entails typing in a question like: "How many square feet are in a square mile?"


If you do that for 220 square miles, the result is shown below in an image:


What do the numbers in the image above mean?


For every 220.64 square miles, there are 6.15 billion square feet.  That is a conversion factor.


If you were to replace the 220.64 square mile by 1 square mile, the answer on the right hand side of the equal sign would be the conversion factor.  This would be the number to multiply to get to square feet.


Now that the amount of square feet of Skopje is known, the remaining parameter is the height along with an expression to calculate the volume of the rainfall.  To begin with, the expression for the volume of rain across a given square foot area with a certain height is shown below:


From the information reported coupled with the results of the calculations, the expression for the volume of the rainfall can be calculated as shown below:


Note: the value of 1.67 ft is the converted reported value of 20 inches into units of feet.  The above calculation states that across the city of Skopje a total volume of 10.3 billion cubic feet of rain was reported -- Wow.  The volumes keep getting larger compared to Mexico with 836 million cubic feet.  Although, the value is small compared to 580 billion cubic feet for China.  Still, the amount of rainfall has caused considerable damage across the region and therefore cannot be understated.  The same can be said for the torrential rain in Huauchinango (Mexico) with loss of life too.


Next, in order to compare with values of volumes expressed in units of 'gallons', the volume needs to be converted as shown below:


The result of the conversion states that in 10.3 billion cubic feet of water, there is a corresponding 76.8 billion gallons of water.  These two values are enormous and incomprehensible.  As with other blog posts on this site, a little dimensional analysis is necessary to put the volumes into perspective.


First, in light of the Olympic Games taking place in Rio over the next few weeks, why don't we use the volume of an Olympic Size Swimming pool as a metric?


Hopefully, this will allow us to more easily visualize the volume of water produced in the calculations above.


How Many Olympic Pools Could Be Filled?


The question that needs to be answered in this section is the following:


How many Olympic Size Swimming pools can be filled with 76.8 billion gallons of water?


In order to start the calculation, the volume of an Olympic Size Swimming pool needs to be known.  If you are a returning reader of the blog, you are probably thinking the following: "Mike, as we know, the volume used in previous calculations is 660,000-gallons"  You (the reader) are correct.  We know this from previous blogs and the first blog (which can be found here).


There is nothing magical about the volume -- which can be found on "Wikipedia" along with the reference to the image of an Olympic Size Swimming pool shown below:


Source: Ahl Baku


With the volume expressed in units of 'gallons' and the total volume (76.8 billion gallons) expressed in units of 'gallons' -- a simple dividing of the two values yield the number of swimming pools which would be filled with the rainfall:


The result indicates that a total of 116,363-Olympic Size Swimming pools could be filled with the volume of 76.8 billion gallons of water.


Does that seem reasonable to you?


Don't worry, unless you have been reading previous blog posts on the site that deal with large volumes of liquids, the guess might not come naturally.


Is there another volume that be used to visualize the enormous number?


How about the Mercedez Benz Superdome in Louisiana?


Below are the calculations for the superdome.


How Many Superdomes Would Be Filled?


The Mercedez Benz Superdome is an indoor football stadium located in Louisiana and is shown below:


Source: Wikipedia


As you can see, the structure is huge and seems like a reasonable metric to use in dimensional analysis calculations.  According to the 'Wikipedia' page, the interior volume of the superdome is 125 million cubic feet.  Since the calculation above for the volume was initially expressed in units of 'cubic feet' (10.3 billion cubic feet), the two numbers simply need to be divided as shown below:


Wow! Wow! Wow!  Unbelievable.  When you stop to consider that the amount of water that fell from the sky could fill 82 superdome structures, your mind should be blown away.  At least mine was.  I am still in disbelief.


Where does all the water come from?


This highlights the amount of water in the atmosphere.


Conclusion...


The amount of water that has fallen in the form of rainfall over the past few months is truly mind boggling to say the least.  Unparalleled is the devastation through the disaster that is caused to infrastructure, life (loss of life), government, etc.  The situation is without explanation by science -- except to say that climate is changing throughout the world.  If this is a sign then, Wow -- we had better start thinking about solutions very quickly.  The harm done to society is getting worse.  Most of the fallout of the destruction from all of the rainfall remains to be seen.  I am not just talking about Macedonia, but of the following recent floods: China, Mexico, and Maryland (USA).  Not to mention the man made disasters that are caused by the unwillingness of our members of the world to engage with science and start offering solutions through policy changes.


One of the over arching goals of this site is to demystify science for everyone.  Teach others how to perform calculations -- just in case you were wondering how to calculate the amount of rainfall that a storm dropped on a given region.  The solution may not be exact, but is with approximations that are given in the underlying assumptions.  The steps of defining a problem, give values to parameters, then evaluate the solution is a large part of science.  A crucial one indeed.  I hope that you have enjoyed the posts on the volume of rainfall along with other dimensional analysis posts.


I truly believe that an educated society is a society that will inhabit a healthier environment and community.  Lets work together to make the world a better place through educating ourselves.  Have a great day.


How Much Rain Did Huauchinango (Mexico) receive?

Hurricane Earl ripped through the mountainous region of Mexico dropping a large amount of rain across an inclined terrain.  How much rain did the town of Huauchinango receive to impart such deadly results?  Below are the results that have thus far contributed to the unfortunate deaths of 39 innocent people.


How Large Is Huauchinango?


In order to understand the devastating impact that rain can have across a given region, there are parameters that need to be known: population, size of city, and amount of rainfall.  When rainfall imparts itself on a given region, the volume is usually the most critical aspect aside from the infrastructure in place by the city officials.


Unfortunately, when the rainfall is accompanied by thrashing winds with speeds in the tens to hundreds of miles per hour, then the destruction is amplified.  These events are tragic and leave a lasting disastrous effect on a region.  Let us hope that the destruction is minimized as much as possible.


According to a twitter post shown below, Hurricane Earl has already taken 39 lives and caused major flooding across Mexico.


Upon clicking on the story, the reader is directed to the website "CBS.com" to the story titled "Tropical Storm Javier forms off Mexico as Hurricane Earl death toll rises" that provided further details regarding the destructive effects of Hurricane Earl -- which include the tropical storm Javier.  Here is an excerpt describing the rain fall:


At least 28 people died in multiple mudslides in the mountainous north of Puebla state, National Civil Protection Coordinator Luis Felipe Puente said in an interview with ForoTV. He said 25 of the dead were in various parts of the township of Huaucinango and three were in Tlaola.

Rains also set off mudslides in the Gulf coast state of Veracruz that killed 10 people, officials reported. Gov. Javier Duarte said the landslides were in the towns of Cocomatepec, Tequila and Huayacocotla.

Heavy rain continued in the area, leading officials to close a section of the main federal highway connecting Mexico City to the region. Crews spent the day clearing a number of landslides from the road, but authorities said mud was continuing to slide with the new rain.


The website went on to report rainfall between 4-8 inches of rain with winds up to 45 miles per hour.  In order to get a grasp on the amount of rainfall that dropped onto the mountainous region, a few calculations need to be done.  I have to admit that I have been busy over the last couple of weeks writing similar blog posts.  The disaster due to irregular climate has caused an enormous amount of rain to fall in different regions of the world.


Over the last month, two blog posts have been written about heavy rainfall in different regions -- China and last weekend -- Elliot City (Maryland, USA).  Click on the links to read about the respective rainfall in those regions.  Additionally, I was planning on writing about India last week, but was too busy.


What is going on with the weather lately?


Too much rainfall and destruction.


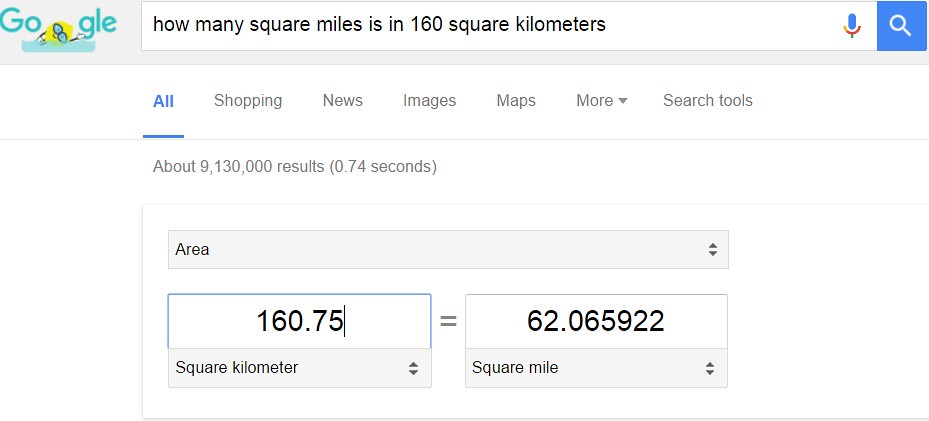
In order to start the calculations -- which are similar in methodology, the size of the city (region) of Huauchinango needs to be known.  According to the "Wikipedia" page for Huauchinango, the size of the region is roughly 160 square kilometers.  Lets take a short cut and ask Google.com to convert square kilometers into square miles to save us one step as shown below in the image:


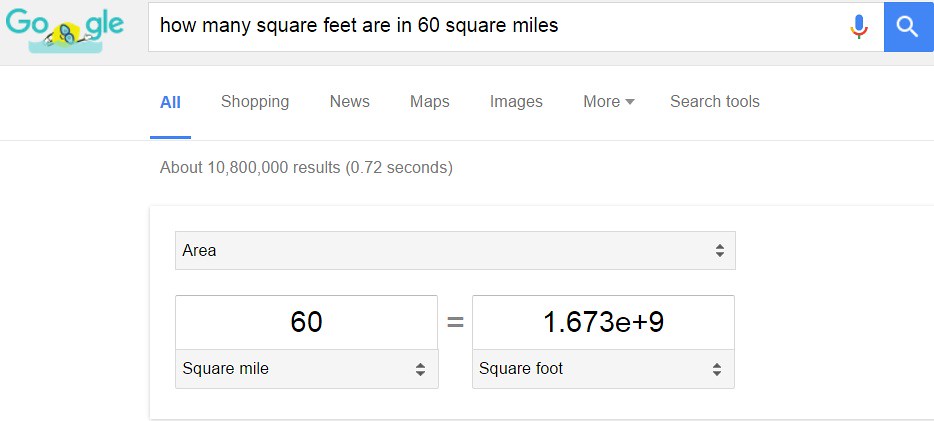
Next, in order to determine the volume of rain that poured down in the city, another conversion of units is necessary.  The conversion from square miles to square feet needs to be done.  Of course, Google.com seems to be a good search inquiry to use (since I am being lazy at the moment).  Below is an image of the conversion factor:


I must point out a slight mistake.  In the first image of the conversion factor from square kilometers to square miles, the number of square miles is equal to 62 sq. miles.  On the next image, I transferred over the wrong number -- slightly less to 60 square miles.  Although, since the point of the post is to approximate a value, I think that I can let this mistake slide.  Forgive me.


According to the news account, the amount of rain that fell was between 4-8 inches.  For the purposes of getting a rough idea, I will use the average of the two numbers -- 6 inches.  In order to calculate the volume of rain, an equation is needed which is shown below:


In the expression (or equation) above for the volume of rain, there are two parameters.  The first is an area -- which has been determined to be 1.67 billion cubic feet of water over an area of 60 square miles.  Whereas the second parameter needed to determine the volume is the height.  The number chosen out of the range was 6 inches of rain  -- which is equal to 0.5 feet.  If we plug those numbers into the expression above, the equation is shown below:


The answer is in scientific notation.  Basically, the total volume rain that fell over an area of 60 square miles is equal to 836 million cubic feet.  Oh my.  Add to that calculation winds approaching 45 miles per hour and destruction is easily seen.  What a terrible situation?


As usual, these large numbers are too astronomical for me to wrap my head around.  Therefore, usually, I try to think of a metric (a known volume) that I can use to cast the result into for me to visualize.  Below are the results of that analysis.


How Many Olympic Size Pools Could Be Filled?


Naturally, when such a large number (actually an enormous number) is the result of a calculation, further dimensional analysis is needed to put the volume into perspective.  What type of metric is appropriate for the volume?  The number is huge.  In order to find a proper metric, a couple of guesses need to be made.


To start with, since the world is fascinated by the Olympics and the world teams competing in the summer events, how about using the Olympic Size Swimming Pool as a metric?


In order to do so, the volume of an average Olympic Size Swimming Pool needs to be known.  Recently, the volume of the pool has been used in another blog post where large volumes of  liquid was the center subject of the post.  A couple of weeks ago, I wrote a post regarding a sewage spill that dumped nearly 2.4 million gallons into the Los Angeles River.  In that post, the metric of a Olympic Size Swimming pool was used to cast the large volume into perspective.  According to that post, the volume of water needed to occupy an Olympic Size Swimming pool is 660,000-gallons.  A picture of an Olympic Size Swimming pool is shown below taken from the "Wikipedia" page:


Source: Ahl Baku


For those readers who have been engaged in watching the games at Rio -- does this look familiar?  As I mentioned the total volume is 660,000-gallons in total to fill up an Olympic Size Swimming pool.  Since, the volume of the total amount of rainfall is known from the calculations above, the two numbers simply are divided by one another.


But wait -- the units are not the same....the Olympic Size Swimming Pool is expressed in units of gallons.  Whereas the volume of rainfall is expressed in units of cubic feet.  In order to perform a direct comparison, a conversion into the same units is needed.  The volume of rainfall is converted into units of gallons as shown below:


Now, with the units both expressed in gallons of the two volumes (Olympic Pool and Rainfall), the two numbers can be divided by each other to yield the number of Olympic Size Swimming pools that could be filled with the total rainfall that the city of Huauchinango experienced over the weekend.  The calculation is shown below:


Wow!  The total amount of rainfall that the city of Huauchinango experienced over the weekend would fill 9,484 Olympic Size Swimming pools -- Wow!


Can you really wrap your head around this?


I have trouble visualizing that amount of swimming pools.


How about using a larger space as a metric?


Mercedez Benz Superdome?


In the past blog posts, a larger volume that has proved handy when enormous numbers are the result of calculations, is the Mercedez Benz Superdome (located in Louisiana) and is shown below:


Source: Wikipedia


Since the volume is extremely large as indicated by the number of Olympic Size Swimming pools, a larger volume is needed to use in carrying out dimensional analysis of the storm in Mexico.  According to the "Wikipedia" page, the interior space (volume) of the superdome is approximated to be around 125,000,000 cubic feet.   In the initial calculation of the volume of rainfall, the answer was expressed in units of cubic feet.  With the values expressed in the same units, a simple division is needed as shown below to determine how many superdome's could be filled:


That is still a large number of superdomes to imagine.  According to the calculation, nearly 7 superdomes could be filled with the total amount of water that fell on 60 square miles in Huauchinango over the weekend.  Wow!


Add into the result the 45 mile per hour wind and the destruction is clearly understandable.  On top of all of this, the region sits on a slope of a hill.  An additional factor of gravity sending the rainfall down a slope would give the storm additional power (destructive power).


Conclusion...


After calculating the total volume of rainfall that Huauchinango received over the weekend, the amount of destruction is more understandable.  Still, the destruction which includes the loss of life is never really understandable.  Storms like tropical storm Javier remind us of the sheer power of nature and that we are a very small part of a larger world.  Additionally, the importance of having the proper infrastructure (buildings, disaster plans, government, etc.) to help out is of the most critical importance.


Looking a the numbers as a result of the calculations.  9,484 Olympic Swimming Pools, nearly 7 Mercedez Benz Superdomes -- these volumes are not trivial or small.  As you watch the games try to imagine the volumes and their relation to the natural disaster.


In the near future, I will write a summarized post of the recent rainstorms that have hit the world and their relative values.  Until next time, have a great day!


Saturday, August 6, 2016

After Reading This, You Might Want To Drink Breast Milk

After reading this blog post, you might want to drink breast milk.   OK, maybe not, but I guarantee that you will not think of milk in the same light next time you look at a glass or see a carton of milk at the store.  How do I know this to be true?  I don't but you can write in the comments the result regardless as time goes on.  Milk is a strange mixture of chemicals.  A pale mixture.  I have another post regarding the pale color of milk that will hopefully come to fruition in the future.  Have you ever wondered what is in milk?  Below, I start a conversation that will turn into multiple blog posts.  With this in mind, lets start with an introduction in this current post.


What Is Milk Composed Of?


What is milk made up of?  Hormones, proteins, other large macromolecules that come from an animal?  Can we make milk?  Yes, humans do -- just look toward any pregnant mother who is nursing a newborn by breast feeding.  The definition of "milk" taken from "Wikipedia" is the following:


Milk is a pale liquid produced by the mammary glands of mammals. It is the primary source of nutrition for infant mammals before they are able to digest other types of food. Early-lactation milk contains colostrum, which carries the mother's antibodies to its young and can reduce the risk of many diseases. It contains many other nutrients[1] including protein and lactose.


After reading the excerpt above, why would anyone want to drink milk after reaching adulthood?  Milk contains a broad spectrum of macromolecules that are nutritious.  What is a "macromolecule"?  Here is a definition from "Wikipedia" of a "macromolecule":


A macromolecule is a very large molecule, such as protein, commonly created by polymerization of smaller subunits (monomers). They are typically composed of thousands of atoms or more. The most common macromolecules in biochemistry are biopolymers (nucleic acids, proteins, carbohydrates and polyphenols) and large non-polymeric molecules (such as lipids and macrocycles).[1] Synthetic macromolecules include common plastics and synthetic fibres as well as experimental materials such as carbon nanotubes.[2][3]


The concept of a macromolecule is generalized by the scientific community.  Basically, when a molecule is considered a macromolecule if the weight is large (on the order of kilo-Daltons) or made up of subunits (and is still large).  What does the concept have to do with milk?


Milk is made up of a distribution of molecules that range in size and shape.  Most of the molecules are on the heavier side (proteins) but still milk contains sugars too.  And as you will see shortly, the sugars play a large role in supplying the microbes contained in your gut -- which additionally plays a role in building the immune system.


What?  Wait.


How did we go from macromolecules to building the immune system?


Fair enough, lets take a couple of steps back in order to move forward toward building the immune system.  Starting from the small scale working our way up, the first stop is the definition of a "monosaacharide" shown below -- taken from the "Wikipedia" page:


Monosaccharides (from Greek monos: single, sacchar: sugar), also called simple sugars, are the most basic units of carbohydrates. They are fundamental units of carbohydrates and cannot be further hydrolised to simpler compounds. The general formula is CnH2nOn. They are the simplest form of sugar and are usually colorless, water-soluble, and crystalline solids. Some monosaccharides have a sweet taste. Examples of monosaccharides include glucose (dextrose), fructose (levulose) and galactose. Monosaccharides are the building blocks of disaccharides (such as sucrose and lactose) and polysaccharides (such as cellulose and starch). Further, each carbon atom that supports a hydroxyl group (so, all of the carbons except for the primary and terminal carbon) is chiral, giving rise to a number of isomeric forms, all with the same chemical formula. For instance, galactose and glucose are both aldohexoses, but have different physical structures and chemical properties.


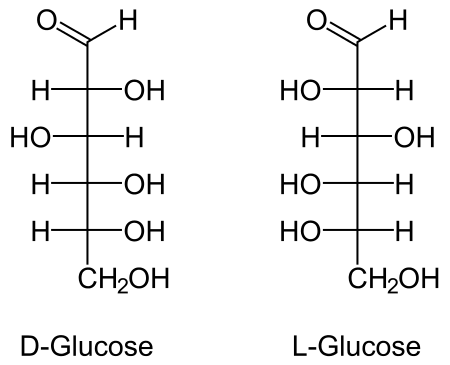
There is a lot of discussion in the media around carbohydrates and fats in regard to nutrition.  Now, you can educate other people that carbohydrates are made up of smaller molecular structures like the commonly stated molecule - 'glucose' - whose molecular structure is shown below:


Source: NEUROtiker


From the molecular structure above, the two monosaacharides shown -- D-Glucose and L-Glucose -- are made up of a certain number of carbon atoms, hydrogen atoms, and oxygen atoms.  These atoms are indicated by the letters "C", "H", and "O" respectively.


Why did I show you these structures?


The reason is to drive home the point of the variability in nature.  While a person who has no training in chemistry might look at the structures above and think there are so many different forms -- how do I memorize or recognize them -- a person with training will see patterns.  The first and most important pattern is that all the molecules of life contain carbon, hydrogen, and oxygen at the very least.  That is why the study of such molecules is classified in the field of chemistry as "organic chemistry."


What do these molecules have to do with proteins, hormones, other macromolecules?


As shown in the definition above, a macromolecule is made up of smaller molecules.  For the molecules associated with life, typically, the basic unit is glucose or another six membered ring of carbon, hydrogen, and oxygen atoms.  If you go onto study chemistry, you will find that the arrangements of the atoms on the rings in space give rise to different structures too.


When basic units are bonded together, the result is larger units -- polysaacharides.  Monosaacharides are the basic units to build larger structures that are commonly discussed in the news.  What?


Yes, as shown in the excerpt above for the definition of a monosaacharide, larger molecular structures such as sucrose and lactose (disaacharides) originate from basic units.  Furthermore, large molecular structures such as cellulose and starch are termed polysaacharides.  I am sure that the last two polysaacharides have crossed your radar before.  Polysaacharides are extremely important in the biochemistry of life.  Here is a definition of a "polysaacharide" from "Wikipedia" shown below:


Polysaccharides are polymeric carbohydrate molecules composed of long chains of monosaccharide units bound together by glycosidic linkages and on hydrolysis give the constituent monosaccharides or oligosaccharides. They range in structure from linear to highly branched. Examples include storage polysaccharides such as starch and glycogen, and structural polysaccharides such as cellulose and chitin.


Polysaacharides can be made up of a number of monosaacharides that have been bonded together in specific manner.  When the number of simple sugars that are linked together lie in a range from three-ten, the class of polysaacharides is known as "oligosaacharides."


Why am I showing all of these structures which seemingly reduce to carbon, hydrogen, and oxygen atoms?


Alright, I will start to get to the point of the blog post -- the newly discovered benefits of breast milk that have been discovered recently.  How?  Part of how has been by focusing on the microbiome.  What?  Turns out that during the analysis of milk, scientists have found a connection between components (oligosaacharides) in milk that work with the microbiome to boost the immune system.  WOW.  Let me explain with the article which spurred the thought to write this post below.


Breast Milk Boosts Immune System Through The Microbiome?


In an article from "The New Yorker" magazine titled "BREAST-FEEDING THE MICROBIOME" the author Ed Yong provided an excerpt from his new book titled "I Contain Multitudes: The Microbes Within Us and a Grander View of Life."  His book, as described by a couple of book review descriptions is a view of the world through the lens of the microbial community.  Which is to say, that Ed shows the value that the microbial kingdom brings to the world around us.  The book has a release date of August 9th, I have pre-ordered my copy.


Specifically, in the excerpt provided in the article on "The New Yorker" magazine, the author discusses the role of microbes play in regards to breast feeding a baby.


Who would have thought that microbes play any role in the process?  


Breast feeding involves the baby and the mother along with the passage of nutrients between the two, right?


 According to the author who has interviewed an array of scientists -- whose research is centered around the topic, that view is only part of the picture.  In the article, the excerpt chosen from his new book introduces the reader to research on milk that is being conducted at the Foods for Health Institute at University of California at Davis.  Milk has a reputation for being a rather simple solution -- which is anything but the case.  Here is an excerpt from the article:


Milk is a mammalian innovation, common to platypuses and pangolins, humans and hippos, its ingredients varying according to what each species needs. Human milk is a particular marvel. Every mammal mother produces complex sugars called oligosaccharides, but human moth­ers, for some reason, churn out an exceptional variety: so far, scientists have identified more than two hundred human milk oligosaccharides, or H.M.O.s. They are the third-most plentiful ingredient in human milk, after lactose and fats, and their structure ought to make them a rich source of energy for growing babies—but babies cannot digest them. When German first learned this, he was gobsmacked. Why would a mother expend so much energy manufacturing these complicated chemicals if they were apparently useless to her child? Why hasn’t natural selection put its foot down on such a wasteful practice? Here’s a clue: H.M.O.s pass through the stom­ach and the small intestine unharmed, landing in the large intestine, where most of our bacteria live. What if they aren’t food for babies at all? What if they are food for microbes?
 This idea dates back to the early twentieth century, when two very different groups of scientists made discoveries that, unbeknownst to them, were closely connected. In one camp, pediatricians found that microbes called Bifidobacteria (“Bifs,” to their friends) were more com­mon in the stools of breast-fed infants than bottle-fed ones. They argued that human milk must contain some substance that nourished the bacteria—something that later scientists called the bifidus factor. Meanwhile, chemists had discovered that human milk contains carbo­hydrates that cow milk does not, and were gradually whittling this enig­matic mixture down to its individual components, including several oligosaccharides. The parallel tracks met in 1954, thanks to a partner­ship between Richard Kuhn (chemist, Austrian, Nobel laureate) and Paul Gyorgy (pediatrician, Hungarian-born American, breast-milk advocate). Together they confirmed that the mysterious bifidus factor and the milk oligosaccharides were one and the same—and that they nourished gut microbes.


 Obviously, the assumption that milk is a simple solution is disputed by the evidence (scientific research findings) over the years.  Although, the benefit of certain ingredients have been an active question over the years -- which research has recently shed light on to settle disputes that have gone on for decades.  This is highlighted in the excerpt above with regard to the role of human milk oligosaacharides(HMO's).


The mysterious player in the equation seem to be the bacteria that live in the gut.  There is a variety that make up a complete microbiome which help defend the body against foreign invaders.  Previous research did not include any consideration of the microbiome playing a role in boosting the immune system.  Lately, with the emerging understanding of various microbiota in foods, products, places -- this view is starting to change.  More will be said about this in future blog posts.


Earlier in the post, oligosaacharides were introduced as a certain class of polysaacharides.   According to the excerpt above, a human mother produces nearly 200 of these oligosaacharides in their breast milk.  The reason for the production of these HMO's has been in question since as discovered by the Germans -- babies do not digest these macromolecules.


What was the purpose of producing the oligosaacharides in breast milk if they did not serve as nutrients for the bifidobacteria?


Scientists learned that the HMO's did not serve as nutrients for the bifidobacteria by extracting the the HMO's and feeding them to various bacteria cultures.  The results suggested that a "subspecies" of bifidobacteria were fed by the HMO's:


The problem soon became clear: H.M.O.s are not an all-purpose food for Bifs. In 2006, the team found that the sugars selectively nourish one subspecies, Bifidobacterium longum infantis. As long as you provide B. infantis with H.M.O.s, it will outcompete any other gut bacterium. A closely related subspe­cies, B. longum longum, grows weakly on the same sugars, and the ironi­cally named B. lactis, a common fixture of probiotic yogurts, doesn’t grow at all. Another probiotic mainstay, B. bifidum, does slightly better, but is a fussy, messy eater. It breaks down a few H.M.O.s and takes in the pieces it likes. By contrast, B. infantis devours every last crumb using a cluster of thirty genes—a comprehensive cutlery set for eating H.M.O.s. No other Bif has this genetic cluster; it is unique to B. infantis. Human milk has evolved to nourish the microbe, and it, in turn, has evolved into a consummate H.M.O.vore. Unsurprisingly, it is often the dominant microbe in the guts of breast-fed infants.
B. infantis earns its keep. As it digests H.M.O.s, it releases short-chain fatty acids, which feed an infant’s gut cells. Through direct contact, B. infantis also encourages gut cells to make adhesive proteins that seal the gaps between them, keeping microbes out of the bloodstream, and anti-inflam­matory molecules that calibrate the immune system. These changes only happen when B. infantis feeds on H.M.O.s; if it gets lactose instead, it survives but doesn’t engage in any repartee with the baby’s cells. In other words, the microbe’s full beneficial potential is unlocked only when it feeds on breast milk. Likewise, for a child to reap the full benefits that milk can provide, she must have B. infantis in her gut. For that reason, David Mills, a microbiolo­gist who works with German, actually sees B. infantis as part of milk, albeit a part that is not made in the breast.


Wow!  The bacteria B. infantis actually communicate with the cells of the human gut to produce a protein to protect the gaps in between them.  Thereby protecting access to the bloodstream and protecting against foreign invaders from attacking our immune system.  The research behind these results is quite amazing.


This is a complete change in thinking about the role of microbiology in our bodies.  Instead of thinking of bacteria that colonizes our gut as "foreign invaders" which our system has to ward off, the colonization is present to promote the health of our immune system by communicating to the gut cells to produce protective proteins.  Additionally, this allows the immune system to build itself up by not having to work as hard in the early stages of development.  Amazing!


As you can see there are many competing factors that contribute to the health of the microbiome.  Aside from feeding the gut bacteria, competition among various cultures of bacteria exists which can contribute to the health of our bodies or have an adverse effect depending on the concentration of the species present.


The idea of stabilizing microbiomes is emerging as an important aspect to our everyday health.  More and more data is starting to emerge with the completion of every study.  The specificity of the results are astounding too.  As an example, here is an excerpt discussing the discovery of the multitude of purposes that the HMO's can serve aside from feeding the B. infantis:


An alternative idea involves diseases. In a group setting, pathogens can easily bounce from one host to another, so animals need better ways of pro­tecting themselves. H.M.O.s provide one such defense. When a pathogen infects our guts, it almost always begins by latching onto glycans—sugar molecules—on the surfaces of our intestinal cells. But H.M.O.s bear a striking resemblance to these glycans, so pathogens sometimes stick to them instead. They act as decoys, drawing fire away from a baby’s own cells. They can block a roll call of gut villains, including Salmonella; Listeria; Vibrio cholerae, the culprit behind cholera; Campylobacter jejuni, the most common cause of bacterial diarrhea; Entamoeba histolytica, a vora­cious amoeba that causes dysentery and kills a hundred thousand people every year; and many virulent strains of E. coli. H.M.O.s may even be able to obstruct H.I.V., which might explain why more than half of infants who suckle from infected mothers don’t get infected, despite drinking virus-loaded milk for months. Every time scientists have pitted a pathogen against cultured cells in the presence of H.M.O.s, the cells have come out smil­ing.


Not only do the human milk oligosaacharides not get digested by the babies, the macromolecules serve to feed the existing dominant strain of bacteria (microbiome) B. infantis.  Additionally, the macromolecules serve as "decoys" for other dangerous bacteria and viruses (to feed on) to avoid getting absorbed in the gut and intestines.  Dangerous bacteria latch onto the oligosaacharides (HMO's) and get swept through our bowels to avoid getting absorbed.  The idea behind the route being that if the bacteria or viruses -- foreign invaders -- do not get absorbed into our bodies, the immune system does not need to fight them off.  Again, allowing the immune system to build itself up during the developmental stage.  Science is amazing.


At the time that the author Ed Yong was writing the book, Prof. David Mills was under the impression (based on studies) that the breast milk from humans only had these nutrients to help B. infantis grow.


According to the "Foods for Health Institute" website, a new article (press release) titled "Cow’s Milk Found to Contain Beneficial Prebiotics for the Infant Microbiome" contains new data that links the same benefits to cows milk too!!!   Here is an excerpt describing the evolution of the studies:


In earlier research, these investigators, led by David A. Mills, PhD, had shown that glycoproteins from milk, which contain both protein, and molecules containing multiple sugars, called oligosaccharides, were the source of that nourishment. They also had found that the infant-associated subspecies of the bacterium,Bifidobacterium longum subsp. infantis (B. infantis), produced an enzyme that could cleave the oligosaccharides from the milk glycoproteins, and they had identified that enzyme.

For the current study, Mills, who is Professor and Shields Endowed Chair in Dairy Food Science, and his collaborators posited that these oligosaccharides were the food source for B. infantis. They then showed that the enzyme could break down glycoproteins not only from mother’s milk, but from cow’s milk, releasing the oligosaccharides.


The excerpt above goes into slightly more detail than Ed Yong's description regarding the role of the subspecies B. infantis.  According the results of the study, the B. infantis produces an enzyme that can cleave (or cut like scissors) the macromolecules into pieces (oligosaacharides are one such piece) which can be used as a "decoy" for dangerous bacteria to latch onto.  The oligosaacharides can also serve as nutrients for B. infantis.


I wonder how much time went and money went into this research.  The amount of testing (growing bacterial cultures, staining, etc.) and characterization (genetic profiling) must have been extremely time consuming.


Conclusion...


The complexity of milk shall never be questioned again after reading this blog post.  Furthermore, the role of the microbiome on human health is just starting to be realized.  Emerging research data is pointing toward the microbiome playing a vital role in our health.  This is a complete reversal to the prevailing view (of being foreign invaders) that occupied scientists minds in the previous decades.  We have just hit the 'tip of the iceberg' so to speak in terms of research and the prospects of the numerous benefits of the microbiome.


As highlighted in the article, there is a large amount of complexity in the process of keeping our immune system healthy.  In the work above, the unveiling of cleaving glycan molecules precisely in order to provide nutrients for the bacteria that are colonizing the gut show the amazing reach and range of research in tackling complex questions.  Questions like the role of various bacteria in our system and the communication between them.  The discussion above highlights the need for scientists to keep forging forward to push the boundaries of our knowledge.  As the boundary gets pushed, the results have an impact through new technologies and products to improve our health.


Who would have thought that the microbiome talked to our gut cells?  


The gut cells make proteins as a result of such communications?


Stop and think about this for a moment.  These results suggest that there an enormous amount of forms of communication between species that have been overlooked or remain to be studied.


What other communication have we missed so far in our research?


With regard to the human body and the ability to supply the proper nutrients, I am astonished.  Scientists continue to amaze me with the results and their continuous motivation to pursue the answers that are hidden within the body.  I am left speechless after writing the blog post.  Questions remain in my mind:


How does the body learn to adapt to the microbiome present in the stomach?  


How is that adaptation communicated to the brain?


There are so many unanswered questions that remain to be answered by science.  Until next time, have a great day!!



Wednesday, August 3, 2016

How Many Square Feet Would Be Required To House All Homeless Residents in Los Angeles County?

How many square feet of shelter would be required to house the entire homeless population in Los Angeles County?  You might be wondering why I ask?  Or, maybe you are just interested in the answer.  The reason why I ask the question can be attributed to an article I read in the Los Angeles Times last week about the expanding home additions occurring in the Los Angeles area -- which is of concern to a large amount of residents.  As a result, I thought of comparing the square footage to that required to house the total homeless population in Los Angeles County.  The results are below.


How Many Square Feet Are Being Added Downtown?


The article that spurred my attention was titled "Op-Ed L.A. has a growing mansionization problem" and written about the expansion of homes in the Los Angeles area.  Popularly known as "mansionizatin" or "McMansion," these home owners are pushing the limits to squeeze every inch of house onto their property without being in violation of city code.  Here is an excerpt from the article describing the situation:


My neighborhood is called either Fairfax Village or Mid-City West or Melrose or maybe all three. It is just north of the Grove and Park LaBrea, just south of West Hollywood. Since I work from home I often take walks nearby to unwind, and they’re usually pleasant, though lately I’ve had to take stock of new construction, new homes coming to market, a new shape and character of the place I live.

Not quite half a block north, I come to the first of several two-story fortresses of solitude, all blocky and bland, with minimal plantings, maximal space, rising high above the surrounding cottages. We call them McMansions, but to me that designation brings to mind something far friendlier, if equally cookie cutter. These structures (I have trouble conceiving of them as homes) are drab, impersonal follies, as ugly as they are obtrusive.


Expanding a neighborhood in this fashion tends to remove the character of the neighborhood at the expense of having extra space (baby room, living room, home gym, spare bedroom - to rent out, etc.).  Whatever the reason for the expansion is beside the point in my mind.  I have resigned to the following mantra: let people be people.  If you want to expand the house out to the curb -- go for it.  Of course, I am not a homeowner at the moment.  If I were, I would probably feel quite differently.


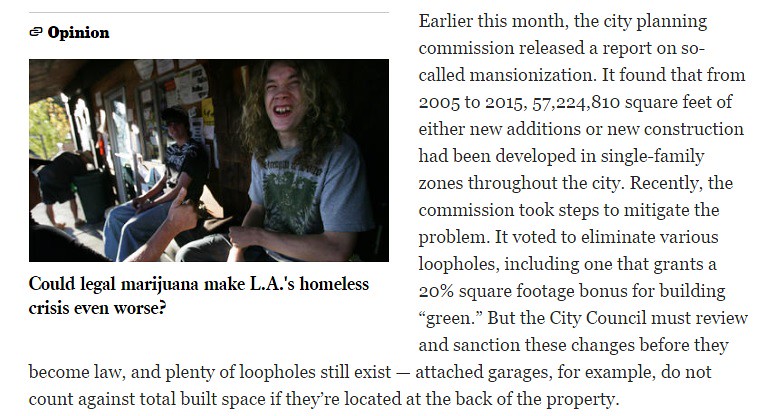
Regardless, in the same article, the author discusses current statistics that were recently released by the county commissioner's office.  Here is an image of the article taken as a screenshot shown below:


I chose to add the image because the caption of the article being advertised was "Could Legal Marijuana Make L.A.'s Homeless Crisis Even Worse?" -- which probably was stewing in the back of my mind.  I imagine a part of my brain was processing this image in the back with the following sub-thought:


Could the additional space be used to house homeless people -- people actually in need?


After I read the shocking number of 57,224,810-square feet which represents either new construction or additions, my mind started racing.  A disclaimer: My wife and I live in a 350-square foot house in Glendale built in 1929 (with the washer and dryer on the back porch).  Therefore, the question of how much space people need is natural for residents like us.


In light of the revealing statistic regarding the space added to the Los Angeles area over the last few years, lets return to the question in the title:


How many square feet would be required to house the total homeless population in Los Angeles County?


How Many Homeless People Live In L.A.?


To calculate the space required to provide shelter to the total population of homeless in L.A. county, the number must be known.  How does on go about finding such a mysterious number?


I typed into google the following question: How many homeless people are there in Los Angeles County?


After scrolling down through most of the page -- which were filled with 'ads' -- I found a few sites that seem to offer accurate numbers.  One of the 'hits' was to the website 'Los Angeles Almanac' with the following information in the excerpt below regarding the fluctuating numbers throughout the year:


According to the Institute for the Study of Homelessness and Poverty at the Weingart Center, an estimated 254,000 men, women and children experience homelessness in Los Angeles County during some part of the year and approximately 82,000 people are homeless on any given night. Unaccompanied youth, especially in the Hollywood area, are estimated to make up from 4,800 to 10,000 of these.

Although homeless people may be found throughout the county, the largest percentages are in South Los Angeles and Metro Los Angeles.  Most are from the Los Angeles area and stay in or near the communities from which they came. About 14 to 18 percent of homeless adults in Los Angeles County are not U.S. citizens compared with 29% of adults overall. A high percentage - as high as 20 percent - are veterans. African Americans make up approximately half of the Los Angeles County homeless population - disproportionately high compared to the percentage of African Americans in the county overall (about 9 percent).


The numbers seem to reflect the complexity in obtaining the statistics throughout the year.  After all, trying to get a "true" number might be extremely difficult.  Why?  Try to be everywhere at once with a clipboard to count!  Organizations come up with numbers which differ as do the news organizations which report them.


To start any reasonable calculation, a value must be known.  According to the values cited above, the number is a range from 82,000-250,000 homeless residents.  I say this because the calculations will reveal the range of space needed to compare to the number of square feet (over years) in new construction going up in the Los Angeles area as each can differ greatly.  


How Much Space Is Required To House 82,000 Residents?


In order to calculate the space needed, the space per person needs to be known.  How much space do we allocate (in our calculation) for each homeless person and still be somewhat accurate?  I searched the internet looking for the average space allotted to each resident in a homeless shelter.


What did I find out?


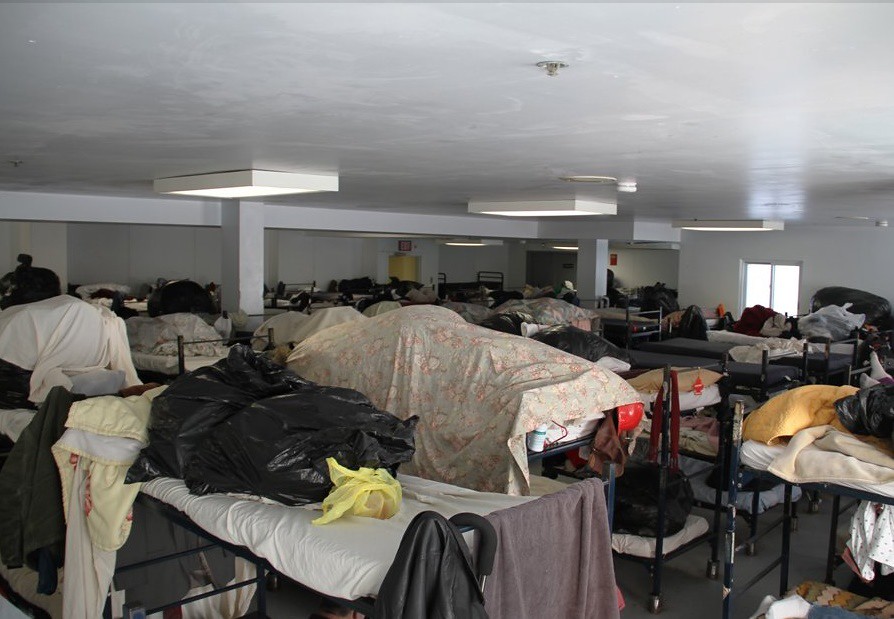
I found an article on the website 'BusinessInsider.com' titled "I Spent The Night In A Homeless Shelter—Here's What It Was Like" providing a first hand account of spending the night in a homeless shelter.  The shelter that the reporter stayed at was located in Atlantic City, New Jersey.  Here is a picture tour of his stay.  In one picture shown below is an open-room concept with a series of "bunk-beds."


If you keep on scrolling through the pictures, you will arrive at a picture of the oldest resident.  The reason why I mentioned this photo was that he was given his own "dormitory" room with a single roommate.  Since I could not determine the size of the room (from the picture) that housed two people, I searched again on google to find out the average size of a 'college dormitory' room with two students.  The answer I found was that of a college were each room was 12X19 feet.


To start the calculation, an expression (or equation) needs to be set up to represent the calculated value to be determined.  Shown below is an equality that relates the value given 228 square feet (per two people) in a dormitory to the desired number of square feet needed to house 82,000 homeless people:


Let me walk you through the expression that is given above.  On the left, in the numerator (top left) is the variable 'y' which we are assigning to be the calculated square feet needed to house 82,000 homeless people.  In the denominator is the proportion 82,000 people representing the weighted ratio to be used.  On the right hand side, the number 228 square feet is located in the numerator representing the square feet (in a college dorm room = 12 feet X 19 feet) that houses 2 students.


In order to solve the equation above, the number 82,000 people is moved over to be multiplied by the right-hand side of the equation as shown below:


The result of the calculation is on the right hand side of the expression above.  Which is to say, that in order to house 82,000 homeless people using the same metric (proportion) for a college dorm room, the equivalent space required would be around 9 million square feet as shown below in scientific notation:


Now that the space needed is calculated, a direct comparison can be made to the statistic reported regarding the new construction in the Los Angeles area in the 'Los Angeles Times' article above.  In the article, the author cited a value of 57,224,810-square feet of new additions or construction space to the home market.


Clearly, there is enough space to house the lower limit of the range discussed above of homeless people in Los Angeles County!!!


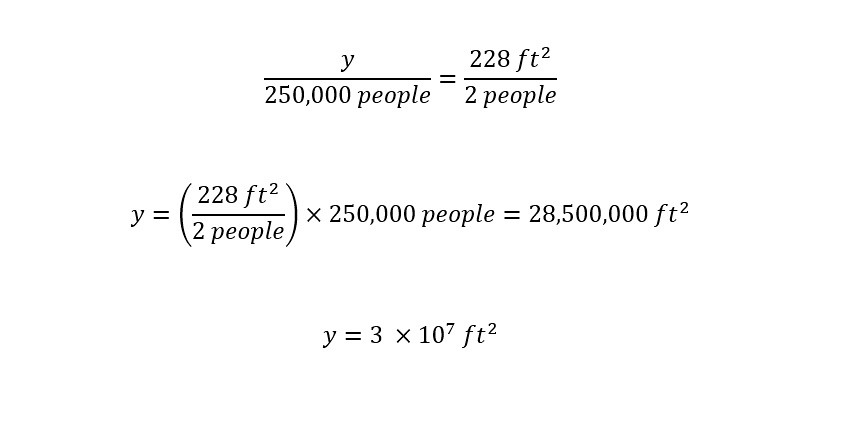
What about the upper limit of the range of homeless residents in Los Angeles County - 250,000?


Is there enough space to house them using the statistic listed in the article?


In order to find out, we can just repeat the same procedure with an equivalent equation shown below.  This is easily accomplished by simply changing the homeless population variable in the denominator on the left-hand side of the expression:


Again, if we compare the result of the above calculation, we find that number needed is around half of the statistic of 57 million square feet.  That is to say, in order to house 250,000 homeless residents in Los Angeles County, the amount of space (using a college dorm as a metric) is 28 million square feet.  Much less that the total number of square feet of space either added or newly constructed.


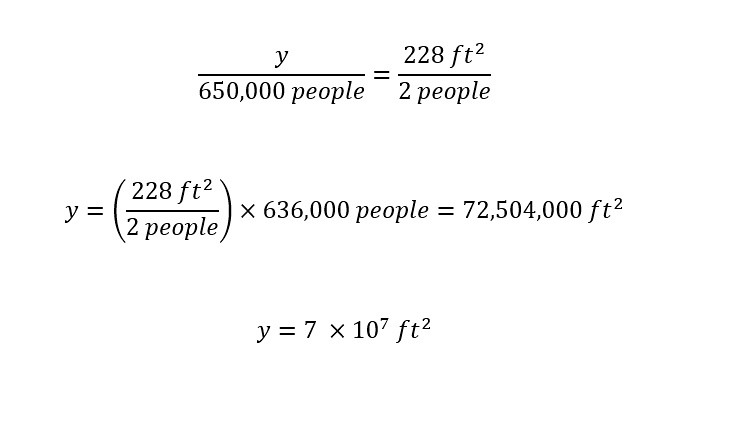
What about the statistic cited in the article from 'BusinessInsider' for the national statistic for homeless people?


How does that number compare to the value calculated using an equivalent equation as above?


Here is the result below:


The result has exceeded the capacity.  Which is to say, 57 million square feet (cited as new construction) is not enough to house the entire 'U.S.' homeless population.  Still, that is a large amount of newly added space (materials, eye-sores, injuries, jobs, etc.) to the County.  Performing the above calculations now casts the homeless population's numbers into perspective.  Are they astronomical?  No person should have to live on the street.


Conclusion...


The results of our analysis show that the space provided to residents in the Los Angeles area is an ample amount to house the entire homeless population of Los Angeles County.  Homelessness is a terrible state of living that should be avoided by citizens of a given region.  Which is to say, we as residents should contact our lawmakers and demand that action be taken.   As you can see, the amount of space that is being granted is much larger than the amount of space needed to house the entire population.  In the article from the 'Times' the author states clearly that the total square footage represents both newly constructed and additions to existing homes.  This means that not all of the money that is going into the construction comes back in the form of taxes to our cities.  At the same time though, there is a cost of time and effort on part of the agencies and politicians time to grant this new space.


With the last couple of sentences in mind, wouldn't the time used to approve such additions be better spent on dealing with the actual residents that have no home?  I think so.


I hope that you visualize these calculations the next time you encounter a homeless person on the street.  I certainly know that I will.  Until next time, have a great day!


Sunday, July 31, 2016

How Much Rain Did Elliot City (Maryland) Really Receive?

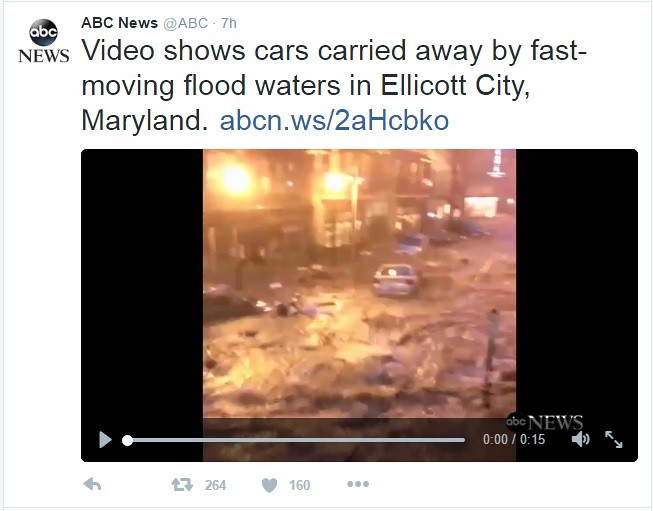
Scrolling down twitter, I found a link to the following video from ABC News regarding last night's torrential rain in Elliot City, Maryland -- shown below:


Based on the past blog post topics regarding "floods" and large volumes of water, I could not help but wonder how much water really fell on Elliot City.  Elliott City is located within Howard County (Maryland).  Below are the results of reported statistics of rainfall.


How Much Rain Is In 12-Inches Of Rain?


According to an article on the news website "ABCnewsgo.com" titled "Flash Flooding, Storms Cause Havoc in Parts of Maryland and New Jersey" between 10-12 inches of rain has fallen over Howard County:


Video captured on Instagram showed cars on at least one street in Ellicott City being carried away in what looked like a tide. A state of emergency was declared for Howard County, and local ABC affiliate WJLA-TV reported "10 to 12 inches of flowing water" along with damages that would take "days to weeks of clean up."


The flash flooding caused a tremendous amount of rain to fall.  In New Jersey, the situation is not better.  Here is another excerpt from the article above:


 In Princeton, New Jersey, water reached waist-deep levels, and in Plainsboro, New Jersey, WABC-TV, an ABC station in New York, reported that cars were rendered immobile by floods, and that there were power outages around that region. Six inches of rain hit parts of the state.


These descriptions along with other articles and video on the internet show an unprecedented amount of rain falling on the region.  In order to fully grasp the content being shown on various websites, a few calculations need to be done to cast the volume of rain into perspective.   Through dimensional analysis, we can figure out the volume of the rain that has been dropped on the entire county (by approximation) and then use a metric to cast that volume into perspective.  Lets start.


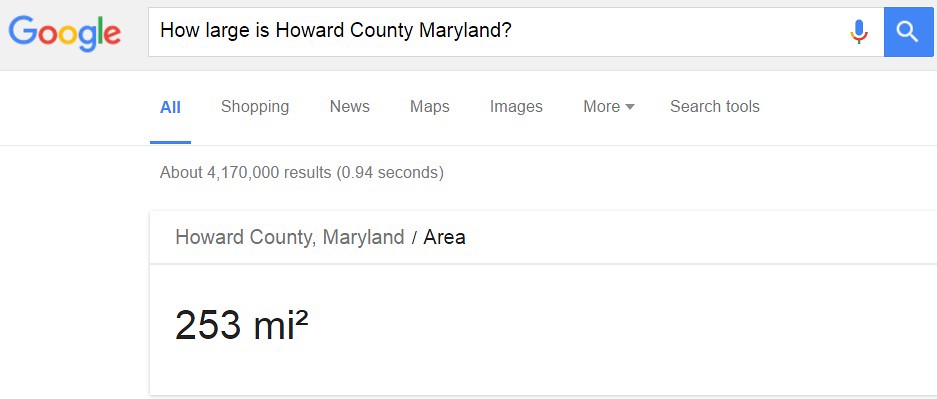
To start the calculation, we need to know the area of Howard County (in Maryland).  How might we find that value?  Why not ask "Google.com"?  Here are the results of my search below as shown:


The total area of Howard County is 253 square miles. Next, according to the news account above, the area received around a foot of rain (reported 10-12 inches).  Remember, the calculations are approximations to inspire readers to think about the relative volumes of rain that come with such natural disasters.


In order to calculate a volume, we need to have an equation for volume -- which is expressed as follows:


Since we know an area (expressed in units) in square miles, a conversion will be necessary given that the reported height in rainfall is expressed in units of "feet."  The conversion factor from square miles to square feet needs to be obtained.  Again, why not ask "Google.com"?  Here are the results:


For ever square mile, there are 27,880,000-feet.   Roughly, Twenty-Eight million square feet per square mile!   With the conversion factor known between units in hand, the calculation can be accomplished as follows:


The number 7.05 billion square feet is the area of Howard County expressed in units of square feet.  First, notice that the number is significantly greater than 253 square miles (which is good) -- signifying that the units are correct.  Next, the area is one part needed to carry out the calculation of the total volume of rain in the equation above.


With the height of the rainfall reported to be around a foot (12 inches), the volume expression shown above can be solved as shown below to calculate the total volume of rain:


That is an extremely large number of cubic feet of rain.  I like to view a numerical value for volume in units of gallons.  I can easily open the refrigerator up in my house and look at a gallon of milk to get a rough idea of the basic unit - the gallon.


The conversion factor between cubic feet and gallons can be obtained from a previous blog (written about the recent torrential rainfall in China).  In every cubic foot of water, there are 7.48052 gallons of water.  With this in mind, the calculation of converting units from cubic feet to gallons is straightforward and shown below:


All together, the total rainfall that Howard County (in Maryland) received was an astounding (an incomprehensible) 53 billion gallons.  How can we get our heads around the value of 52.7 billion gallons of rain?  Lets try using a metric below to visualize .  Read on to find out!


How Many Empire State Buildings Could be filled?


To really understand the magnitude of that volume of rain, a proper metric is needed.  How about using the Empire State Building?  Here is a picture taken from the "Wikipedia" page shown below:


Source: Wikipedia


How many Empire State Buildings would be filled with 7.05 billion cubic feet of water?


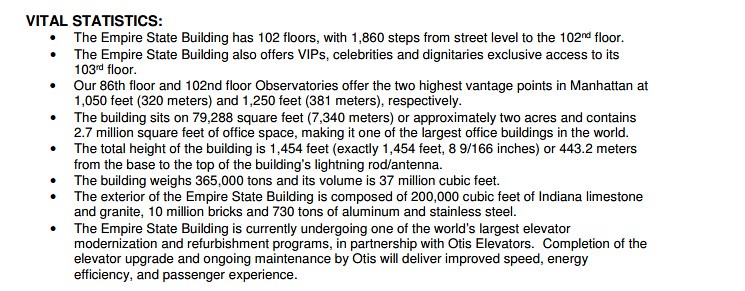
In order to carry out the calculation, the volume of the Empire State Building (shown in the picture above) must be known.  If you do a search in "Google.com" you will find the answer to be located on a website "ESBNYC.com" with a stated value shown below:


Bullet statement #6 states that the total volume of the Empire State Building is 37 million cubic feet.  Wow.  That is large.  How does 37 million cubic feet of space compare with the total volume of rainfall across Howard County of 7.05 billion cubic feet?  Obviously, the answer will entail a multiplication factor between the two.  The calculation of the number of Empire State Buildings that would be filled is shown below:


Wow, Wow, Wow!  The result really drives home the point of using dimensional analysis to cast a metric to put the volume into perspective.  Although, as with other large volume analyses on this website (click on the tag Large Volume Analysis to access all), the number of structures that could be filled are truly incomprehensible.  Although, the utility of performing dimensional analysis is to give the reader an idea of the scale of the problem (or natural disaster).


What do I mean by the last sentence?


Upon calculating the number of Empire State Buildings that could be filled to be 190 buildings, one can try to visualize the following:  Imagine spreading the volume of 190 Buildings stacked together over an area of 253 square miles.  The volume would obviously shrink as the area increases to eventually cover 12 inches.


After spreading the volume contained in the Empire State Buildings out to an area of 253 square miles, the picture would look like the following taken from "Twitter" shown below:


In the picture above, the cars are being carried down the street by the rainfall which resulted in extreme flooding.  Regardless of the analysis that we try to perform here on this site, any loss of life is incomprehensible as well.  Natural disasters cause a person to take a step back and appreciate what life we have.  I hope that you do the same too as watching this one unfold on social media.


Conclusion...


Any loss of life due to natural disasters is a terrible thing to have to consider.  The amount of rainfall that fell over the weekend on Elliot City and broader -- Howard County inflicted great damage.  The analyses here showed the volume to be around 190 Empire State Buildings worth of water.  Yes, that is correct.  The amount of rainfall could fill 190 buildings -- Wow.


For a homework assignment, figure out the amount of Mercedes Benz Superdome (pictured below) that could be filled with the equivalent volume of water.


Source: Wikipedia


Before you carry out the calculation, take a guess whether the amount of Superdomes would be greater or lesser than the amount of Empire State Buildings.  Provide your answer in the comments sections below.  Until next time, have a great day!


Thursday, July 28, 2016

'Wayfinding' Signs Are For Everyone Not Just Tourists!

The concept of a 'wayfinding' sign is typically thought of to assist tourists in a city or a region to get around.  Why do we restrict our thinking to such narrow benefits for a select population?  According to a recent news article, the typical thinking was reported on and struck me as dull -- not really exciting.  Why?  Read on below to find out why.


Wayfinding Signage?


What is 'wayfinding' signage?  What is the utility of such signage?  What does that signage look like?  All of these questions are acceptable in this day and age.  Especially as different urban areas try to transition toward designing downtown regions which motivate residents and tourists to engage in greater active modes of transportation -- when moving around.


Here is an example of a 'wayfinding' sign in Glendale (California, USA) shown below:


Source: Roger Wilson/LA Times


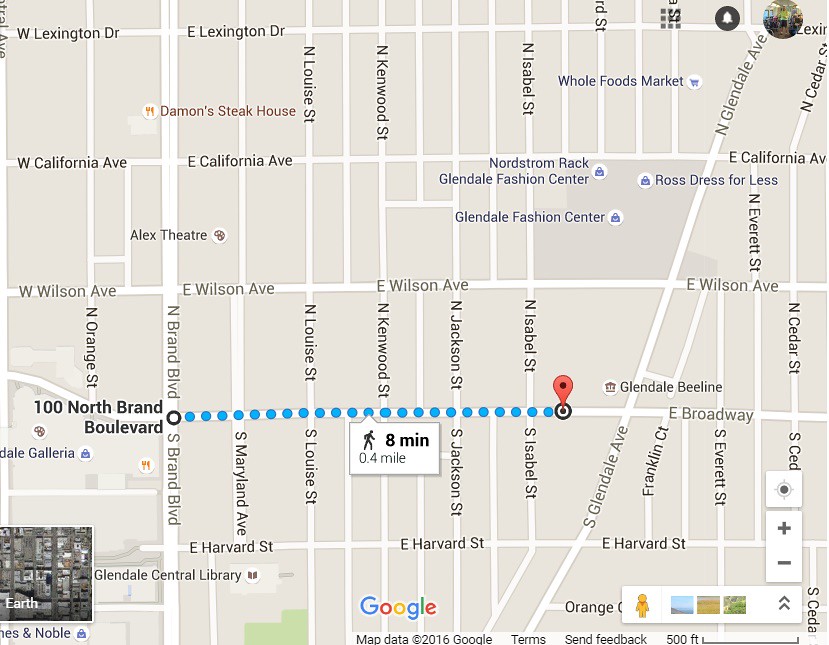
Upon inspection of the sign in the picture above, there is a time printed on the sign and a destination.  In this case, the time that a person would have to walk (7 minutes) from this point to the shops on Brand Blvd.  Here is an image of a map taken from GoogleMaps outlining the distance stated on the sign below:


The sign shown in the picture above was taken from an article in the Sunday 'LA Times' titled "New 'wayfinding signs' encourage pedestrians to take a stroll around Glendale."   Among the paragraphs in the story, three stood out in particular.  The first excerpt highlights the reason for the signs as shown below:


Dubbed "wayfinding signs," the signage along local sidewalks serves two purposes: they contain health tips and point in the direction of local landmarks such as the Glendale Galleria and the Americana at Brand.

"We're thinking they'd be helpful for visitors, people who may not necessarily be familiar with all the sights and attractions here in town, and residents may find a hidden jewel in their neighborhood," said Juan Gonzalez, neighborhood services supervisor for the city.


The City of Glendale has the correct intentions for tourists.  Although, tourists should not be the only audience that transportation experts are targeting.  The overall mission of transportation authorities should be to target everyone living within walking/biking distance (<3 miles) of the downtown area.  Especially, as this mission is aligned with the mission of Measure R2 and with Governor Jerry Brown's vision of engaging a greater population in using active modes of transportation (i.e., motivating active transportation).  For those who are unfamiliar with Measure R2, the measure is a huge transportation bill to be added to November's ballot -- which will supply billions of dollars over the next few decades (read more here).


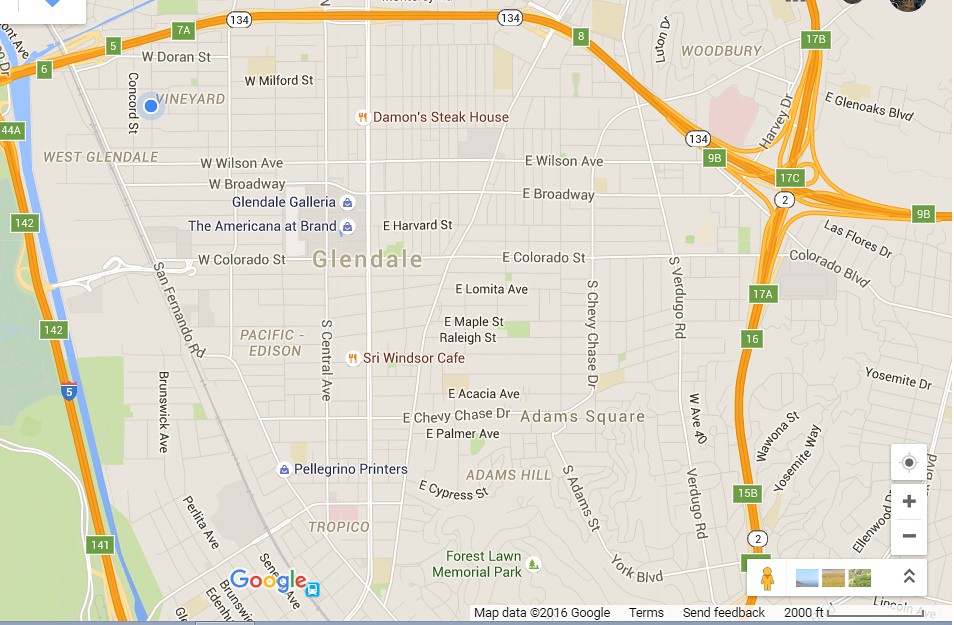
These distances can easily be traveled safely and quickly by bicycle - but remain unknown to the average resident who mainly relies on their vehicle to travel short distances (which is astounding).  Additionally, the city should be emphasizing the relative distances associated with traveling within the "downtown area" of Glendale.  Here is a map of South Glendale (that is below the 134 Fwy) shown below:


The scale is  located at the bottom right.  As the reader can see, the entire "downtown" area (including residential areas surrounding downtown) spans may 2 miles wide by 3 miles in length (running North to South).  Residents could easily walk and bike around the area where all of the major business is conducted if they had a better grasp of the relative dimensions of the city.


One of the main motivations of writing for this blog site is to demystify reported statistics in the popular news using dimensional analysis.  Viewing a map in context to scale and relative distances, should motivate residents of the area -- not just tourists to walk and bike rather than drive.


In the first map shown above, the time that a person needs to travel from City Hall to Brand Blvd is only 8 minutes.  I wonder how many of the public employees who work at City Hall (Council members and Mayor) walk to Brand Blvd for lunch?  Furthermore, how many of the politicians walk the city rather than drive?  Maybe that is a question that needs to asked of the city in the near future.


The lack of participation in active transportation seems to be mainly centered around awareness.  Residents in the city have not the awareness of the relative times that is required of them to travel the relative distances.  As usual, I try not to bring any subject up if I am unwilling to help in increasing the awareness -- which I have in the past.


How Long Does It Take To Walk Downtown?


Understanding the relative times that is required to travel a certain distance is critical in motivating the use of active modes of transportation.  I have written on this site previously about eliminating the separation of commuting and leisurely trips when it comes to active transportation.   Every trip should be an active transportation trip!


What is our part in the process?


We started the nonprofit organization 'Bikecar101' -- with a mission of the following: to advocate for and educate the public about bicycle on public transit trains.  How does this correlate to the subject at hand -- wayfinding?


and the other video:


In each video, we started the experiments from the West side of town.  From our house, we traveled to the center (to the Americana) and to the East side (to the fountain - second video).  Which means that if residents are willing to walk around a mile each way, there is no need to use a car.


Of course, if the purpose of the trip is to buy groceries (in large quantities) or heavy objects from the mall, that is an exception to the rule.  Think about how much healthier the residents of Glendale would be if there was a higher participation in active transportation.  In the article above, the distance highlighted by the 8 minute walk drove home the point that anyone living in the vicinity of City Hall does not need to drive (every time) to get to Brand.  Plus, here is an excerpt from the article highlighting the health benefits:


As for health tips, one of the signs states that doctors recommend walking 6,000 steps a day to improve one's health and 10,000 a day to lose weight.
There's also a social-media campaign as part of the program. Pedestrians are encouraged to snap selfies of themselves with a wayfinding sign in the shot and share the pictures on social media with the hashtag #GlendaleWalks.


Any person can easily achieve 10,000 steps by traveling using active transportation in a given day.  There is no excuse.  The information is present in the article.  You might ask then the following question:


What is wrong with the article?


Conclusion...


Again, the 'wayfinding' signs are a wonderful addition to the City of Glendale.  I hope that as the transportation experts around the Southern California area move forward in motivating voters to go out and support Measure R2 this November, we remember the overall mission.  It is imperative that the all active modes of transportation be emphasized.  Walking, biking, along with the use of light rail, bus rapid transit affords the opportunity to travel over a wide range of distances here in Southern California.  In order to drive home the concept, each of us advocates need to demystify the distances that are available to walk/bike in our respective cities.


'Wayfinding' signs contribute greatly to this effort.  Although, if each of us do not contribute and explain to our fellow citizen the purpose of these additions (signage), then they will go unnoticed.  Walking/biking is demystified by various exercise groups on the weekends along with local bicycle coalitions (the Los Angeles County Bicycle Coalition hosts a Sunday "Fun day" ride each month).  Working together, come November, Measure R2 will become a reality.  Then the real work continues to be our duty -- spread the word by education to produce a better society.  Each City needs to work together to become a region promoting healthy and sustainable transportation.  Infrastructure and tourism is just one part of a larger solution.


To stay informed on transportation, infrastructure, and advocacy issues in the region read the vast coverage (while up to date) at StreetsblogLA.org.