Recently, I was listening to a radio show called "StarTalk" with the physicist Prof. Neil deGrass Tyson. The episode was a panel of astrophysicists talking about the study of 'black holes' in our universe -- which was completely fascinating I might add. During the discussion, there was a large amount of dimensional analysis going on in order to drive home the relevance and complexity associated with studying 'black holes' from Earth. One statistic popped up out of nowhere:
If the Sun was filled with water, it would weigh nearly as much as it does now!
At the time, I was riding the train back home from vacation and did not have my laptop handy to look up a few values to explore the stated statistic further. Since then, the statement has been lingering in the back of my head. Today, I decided to perform a couple of calculations to either verify or debunk that statement. Below are the result of those calculations.
How Much Does The Sun Weigh?
In order to tackle such a calculation, a few values need to be known. First, the weight of the Sun needs to be obtained. If the weight of the Sun is not known, then a comparison based on an analysis is useless. Second, the Sun will be approximated as a perfect sphere for calculation purposes. Third, since the sphere is going to be used as the shape of the Sun, then a formula for the volume needs to be obtained. Finally, the density of water needs to be known to use as a correlation factor of volume to weight. Right about now you are probably thinking the following:
How do all of these values and formula come together to confirm the statement above?
I will show you in the paragraphs below. In order fully grasp the nature of the analysis that is about to unfold, lets cast the Sun into a better perspective. The weight of the Sun can be obtained from the resourceful "wikipedia" page along with other useful facts such as the description shown below:
The Sun is the star at the center of the Solar System. It is a nearly perfect sphere of hot plasma,[13][14] with internal convective motion that generates a magnetic field via a dynamo process.[15] It is by far the most important source of energy for life on Earth. Its diameter is about 109 times that of Earth, and its mass is about 330,000 times that of Earth, accounting for about 99.86% of the total mass of the Solar System.[16] About three quarters of the Sun's mass consists of hydrogen (~73%); the rest is mostly helium (~25%), with much smaller quantities of heavier elements, including oxygen, carbon, neon, and iron.[17]
Wow! The description above sets the tone for the following analysis. First, the numbers involved are going to be VERY large (many zeroes before the decimal place). The Sun is enormous and dwarfs the Earth easily in its description. The weight of the Sun is listed on the 'wikipedia' page as the following:
The mass of the Sun above is expressed in 'Scientific Notation' to abbreviate the enormous number. Typically, scientist use this 'abbreviated notation' to express huge numbers more easily. At the same time, scientific notation can also be used to express very small numbers (i.e., a billionth of a meter, a nanometer = 1/1,000,000,000 meter). If the mass of the Sun expressed in scientific notation was written out in long form, the mass would appear as shown below:
Alright. After viewing the mass of the Sun in long form, the ease of using 'Scientific Notation' is completely understandable.
To start the calculation, the volume of a sphere needs to be known. Below is the volume of a sphere in equation form:
In order to calculate the weight of the Sun filled with water the following steps need to be taken:
1) Obtain the radius (denoted as 'r') of the Sun
2) Calculate the volume of the Sun
3) Calculate the mass of the Sun from the volume (with the density of water)
4) Compare the calculated mass of the Sun to the stated mass (above) from 'wikipedia'
The steps are quite simple. Keep in mind though, that in order to compare or calculate values, wthe values need to be in correct 'units' (i.e., 'kilogram,' 'gram,' 'milliLiter,' 'Liter,' or 'cubic meters'). Otherwise, completing calculations and comparing calculated volumes is impossible -- like 'comparing apples with oranges.'
With this in mind, lets start calculating the mass of the Sun filled with water following the steps above. First, the radius of the Sun needs to be known. From the 'wikipedia' page, the radius of the Sun is stated to be either 695,700 kilometers or 109 times the radius of the Earth. Expressed in long form for the calculation, the radius of the Sun is shown below:
The radius of the Sun can be directly plugged into the equation for the volume of a sphere above to yield the following:
The volume of the Sun is shown above. In order to calculate the mass from the volume, we need the density of water. Density is the amount of mass contained in a given volume. For water, the value of the density is 1.00 gram/milliLiter. Since there are 1000 milliLiters in a single Liter, then the density for water can be expressed as 1000 gram/Liter.
The expression for density of a given molecular compound can be expressed as the 'mass' per 'volume' as shown below:
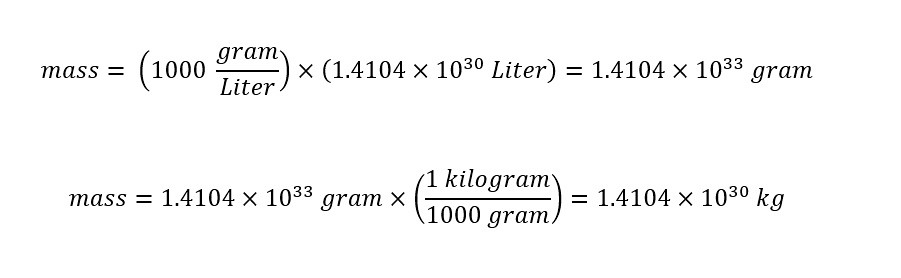
The first line shows the equation for the density of a given molecular compound. In the second line, the equation is re-arranged to yield the 'mass' from the two parameters 'density' and 'volume'. Plugging in the values from the calculation and reference (density) value, the 'mass' of the Sun can be calculated as shown below:
The calculated mass of the Sun is shown above. Of course, the value of the mass is enormous as expected -- which is good. Returning to the statement above -- which motivated the article:
If the Sun was filled with water, it would weigh nearly as much as it does now!
The following question can be asked regarding the calculated mass and the reference mass listed from 'wikipedia':
How do the two masses (theoretical and calculated) compare to each other?
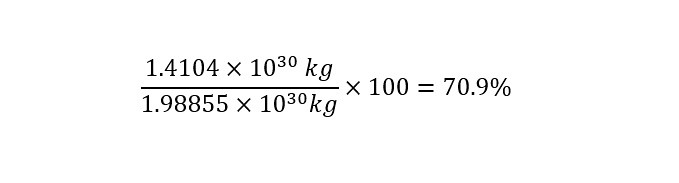
The easiest way to compare two value (in the same units -- i.e. 'kilogram') is to express them as a ratio of each other as shown below:
The result shows that the two values have the same "order of magnitude" -- that is 10 raised to the power of 30. But the two values are NOT nearly the same -- Why Not? Read onto find out.
Plasma Is Denser Than Water
In carrying out the calculation above, there are a number of assumptions listed below:
1) The Sun is shaped as a sphere
2) Density of water at 25 degrees Celsius was used in the calculation
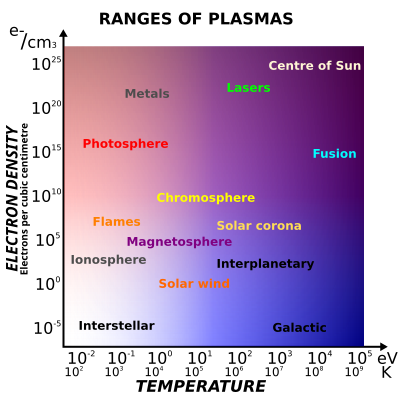
What was not figured in was that the density of an mass can change with temperature. The Sun has a reaction going on in the core of the sphere. There are four states of matter: Gas, Liquid, Solid, and Plasma. In the calculation above, the state of matter used for water was a liquid -- 1.00 gram/milliLiter at 25 degrees Celsius.
According to the 'wikipedia' page for 'plasma,' the density can change significantly with temperature as shown in the image taken below:
Understanding the accuracy of an approximation is crucial to the words that are used to describe the comparison of two values. In the situation of comparing two masses -- the result of the calculation and the theoretical mass from 'wikipedia' -- you can easily see that the two are not comparable. In order to understand the reason why that is the case or might be -- look toward the density of the molecule in question -- in this case water.
The density inside plasma can vary up to 7 orders of magnitude different from that in room temperature. Meaning, you can pack more mass into a given space.
Conclusion...
The above calculation is a great opportunity to illustrate the methodology of carrying out a 'dimensional analysis' problem. Based on the result of the calculation, the statement above regarding the mass of the Sun filled with water nearly being equal to that of the current weight is not necessarily true. Although, the two values did have the same 'order of magnitude' -- 10 raised to the power of 30.
Nevertheless, the exercise was fun and displayed the power of 'dimensional analysis.' Now, you have the ability to carry out the same calculations on your own. The next time that you are listening to the radio or reading the paper and find an interesting fact, you can verify the two values on your own.
Harnessing energy is a 'hot topic' in today's sustainable energy movement. There exists a wide range of possibilities from wearable electronics (in clothing) to wave energy converters (WEC) that convert the mechanical energy of a wave into electrical energy -- that is usable to power electronics. Recently, I was reading about new research being performed at the U.S. Navy's largest wave tanks in Bethesda, Maryland. The width and length were given in the article. As an easy exercise in comparison to other blog posts, I thought that we might explore the height (or the depth) of one of the world's largest wave tank below.
U.S. Navy Wave Tank
The United States Navy has an enormous wave tank located on the East coast in Bethesda, Maryland. Recently, in an article from the website 'Lab Manager' an article appeared titled "Wave Energy Researchers Dive Deep to Advance Clean Energy Source" in which new research into improving the efficiency of wave energy converters was discussed. Here is an excerpt from the article:
ALBUQUERQUE, N.M. — One of the biggest untapped clean energy sources on the planet—wave energy—could one day power millions of homes across the U.S. But more than a century after the first tests of the power of ocean waves, it is still one of the hardest energy sources to capture.
Now, engineers at Sandia National Laboratories are conducting the largest model-scale wave energy testing of its kind to improve the performance of wave-energy converters (WECs). The project is taking place at the U.S. Navy’s Maneuvering and Sea Keeping facility at the Carderock Division in Bethesda, Maryland, one of the largest wave tanks in the world at 360 feet long and 240 feet wide and able to hold 12 million gallons of water.
After reading this excerpt, one should pause to put the research into context by asking the following questions:
How large of area is needed to properly explore the use of new technology in capturing wave energy? Is the area mentioned above appropriate to represent the development of such technology? How deep is such a large wave tank?
The answer to the first is an open ended answer to which researchers probably could continue to expand by building larger facilities to explore the development of such technologies. Although, the funding for research must be present. What does the wave tank look like?Here is a video explaining the operation of this massive research wave tank shown below (less than 6 minutes):
As you can see, this is an amazing research facility of great importance. To be able to acquire detailed information about objects in the ocean is super important. The range of research projects that are possible to explore within the facility is far reaching. Each of us could easily think up investigations that could be carried out in such a large tank. Further, as explained in the video -- to be able to make "any type of wave" in the world is important too. My mind was blown after watching this video of the facility. With the rise of the information age, a facility like this is at the tip of the iceberg in terms of producing valuable data.
But returning to the questions posed after the excerpt in the article above, lets now move to the height of such a tank. How high are the walls? What is an appropriate height for such a facility? Especially when considering the wide variety of waves in the world. In the excerpt, the total volume of 12 million gallons was stated as were the dimensions (area) of the area of the wave tank. Left out was the height of the tank. Why? I don't know. After reading the values of the area, I had to compute the height. The calculations are shown below.
To start with, a couple of equations are needed. The first equation is for the volume of the wave tank. According to the article, the tank is the shape of a rectangle. Therefore, the appropriate expression for the volume of the wave tank is given below:
The volume was stated as 12 million gallons in the excerpt above while the area of the wave tank is given in units of 'feet.' In order to compute a height in 'feet' from a volume expressed in units of 'gallons' -- a unit conversion step will have to be shown. To convert from gallon to cubic feet, the conversion factor is given along with the setup for the calculation:
With the volume now expressed in units of 'feet' rather than 'gallons,' the values can be inserted into the original expression (equation) for the volume of a rectangle as shown below:
Upon first glance, the numbers inserted into the expression for the volume of a rectangle might look confusing at first. Remember, the length and width of the wave tank were given along with the total volume. The difference is the conversion from units of 'gallons' to 'cubic feet' -- which is confusing to a large amount of readers. What is important to note is that the result of the calculation is expressed in the desired units -- feet. Everything adds up -- which is great. Now to compare to the actual value.
How does the calculated height compare with the actual height of the wave tank built by the U.S. Navy?
At first sight, the height of the wall seems higher than 18 feet. In fact, according to an article in 'popular mechanics' the actual height is 20 feet tall. Aha! As you can see the heights are comparable (18 feet calculated to 20 feet actual). Using the equation for the volume of a rectangle is approximately accurate. The actual shape of the basin has curved edges -- which if the rectangle had similar edges the height would increase.
The wave tanks mentioned above are research wave tanks. Additionally, the wave tank mentioned in the title holds the record for being the 'second largest wave tank' in the world. What wave tank holds the largest world record in size? Find out below...
The World's Largest Wave Tank
The award for the world's largest wave tank goes to the Country Holland. Here is a video of the world's largest wave tank shown below:
Notice how the shapes of the two wave tanks above are completely different. This is due to the different purposes each serve. In the first wave tank, from Holland, the research is dedicated to isolating a wave of varying lengths and hammering down the mechanics of formation and break. Whereas the second wave tank was built purely for pleasure.
Children and adults are bouncing up and down and conducting personal experiments with the waves produced. The different shape fits the purpose. In the second case, the purpose is to fill the wave tank with as many people as possible. Some on rafts and others just swimming among the waves for recreation.
For now, we can call the end of the blog at the present length. For the future, you might want to compare the relative volumes of water held in each of the large wave tanks. As I mentioned above, the tanks above span a range of different geometries and capacities. Additionally, each of the above wave tanks serve a unique purpose. Some are for recreation whereas others are critical to the billions of dollars spent on our U.S. Military.
The insight that is possible from an experimental standpoint cannot be overstated. Further the importance of such research is critical to reducing the loss of life along with producing more efficient technology for the future. Wave tanks offer a unique perspective into the amazing vast ocean that each of us confront when visiting the beach. Performing research at the scale of the ocean is way too costly and dangerous. The above efforts display the time and thought that is involved in such research. Careful researchers are improving our lives by researching the prospect of renewable energy and saving large amounts of money in the process.
The next time that you find yourself either at the ocean or the local water park in the waves, take a few minutes and think about the amazing technological developments that science creates to make your lives better. Until next time, cheers!
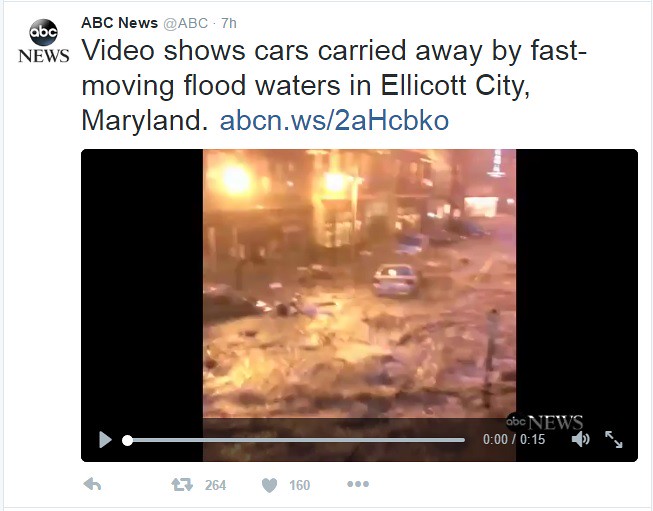
Scrolling down twitter, I found a link to the following video from ABC News regarding last night's torrential rain in Elliot City, Maryland -- shown below:
Based on the past blog post topics regarding "floods" and large volumes of water, I could not help but wonder how much water really fell on Elliot City. Elliott City is located within Howard County (Maryland). Below are the results of reported statistics of rainfall.
Video captured on Instagram showed cars on at least one street in Ellicott City being carried away in what looked like a tide. A state of emergency was declared for Howard County, and local ABC affiliate WJLA-TV reported "10 to 12 inches of flowing water" along with damages that would take "days to weeks of clean up."
The flash flooding caused a tremendous amount of rain to fall. In New Jersey, the situation is not better. Here is another excerpt from the article above:
In Princeton, New Jersey, water reached waist-deep levels, and in Plainsboro, New Jersey, WABC-TV, an ABC station in New York, reported that cars were rendered immobile by floods, and that there were power outages around that region. Six inches of rain hit parts of the state.
These descriptions along with other articles and video on the internet show an unprecedented amount of rain falling on the region. In order to fully grasp the content being shown on various websites, a few calculations need to be done to cast the volume of rain into perspective. Through dimensional analysis, we can figure out the volume of the rain that has been dropped on the entire county (by approximation) and then use a metric to cast that volume into perspective. Lets start.
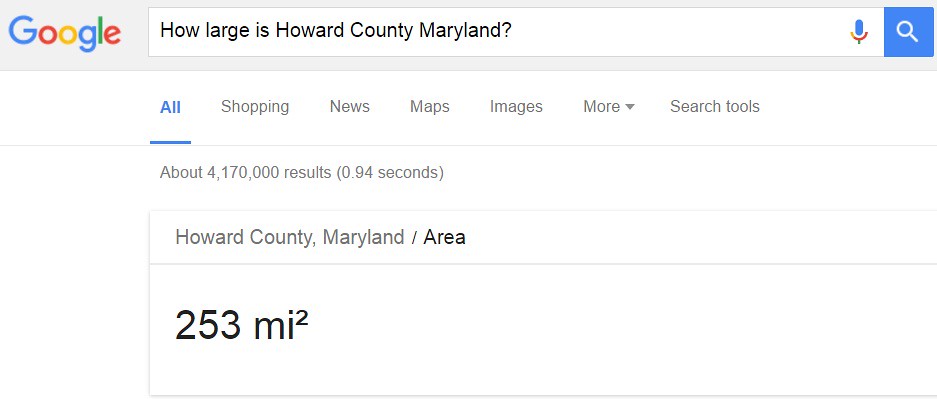
To start the calculation, we need to know the area of Howard County (in Maryland). How might we find that value? Why not ask "Google.com"? Here are the results of my search below as shown:
The total area of Howard County is 253 square miles. Next, according to the news account above, the area received around a foot of rain (reported 10-12 inches). Remember, the calculations are approximations to inspire readers to think about the relative volumes of rain that come with such natural disasters.
In order to calculate a volume, we need to have an equation for volume -- which is expressed as follows:
Since we know an area (expressed in units) in square miles, a conversion will be necessary given that the reported height in rainfall is expressed in units of "feet." The conversion factor from square miles to square feet needs to be obtained. Again, why not ask "Google.com"? Here are the results:
For ever square mile, there are 27,880,000-feet. Roughly, Twenty-Eight million square feet per square mile! With the conversion factor known between units in hand, the calculation can be accomplished as follows:
The number 7.05 billion square feet is the area of Howard County expressed in units of square feet. First, notice that the number is significantly greater than 253 square miles (which is good) -- signifying that the units are correct. Next, the area is one part needed to carry out the calculation of the total volume of rain in the equation above.
With the height of the rainfall reported to be around a foot (12 inches), the volume expression shown above can be solved as shown below to calculate the total volume of rain:
That is an extremely large number of cubic feet of rain. I like to view a numerical value for volume in units of gallons. I can easily open the refrigerator up in my house and look at a gallon of milk to get a rough idea of the basic unit - the gallon.
The conversion factor between cubic feet and gallons can be obtained from a previous blog (written about the recent torrential rainfall in China). In every cubic foot of water, there are 7.48052 gallons of water. With this in mind, the calculation of converting units from cubic feet to gallons is straightforward and shown below:
All together, the total rainfall that Howard County (in Maryland) received was an astounding (an incomprehensible) 53 billion gallons. How can we get our heads around the value of 52.7 billion gallons of rain? Lets try using a metric below to visualize . Read on to find out!
How Many Empire State Buildings Could be filled?
To really understand the magnitude of that volume of rain, a proper metric is needed. How about using the Empire State Building? Here is a picture taken from the "Wikipedia" page shown below:
How many Empire State Buildings would be filled with 7.05 billion cubic feet of water?
In order to carry out the calculation, the volume of the Empire State Building (shown in the picture above) must be known. If you do a search in "Google.com" you will find the answer to be located on a website "ESBNYC.com" with a stated value shown below:
Bullet statement #6 states that the total volume of the Empire State Building is 37 million cubic feet. Wow. That is large. How does 37 million cubic feet of space compare with the total volume of rainfall across Howard County of 7.05 billion cubic feet? Obviously, the answer will entail a multiplication factor between the two. The calculation of the number of Empire State Buildings that would be filled is shown below:
Wow, Wow, Wow! The result really drives home the point of using dimensional analysis to cast a metric to put the volume into perspective. Although, as with other large volume analyses on this website (click on the tag Large Volume Analysis to access all), the number of structures that could be filled are truly incomprehensible. Although, the utility of performing dimensional analysis is to give the reader an idea of the scale of the problem (or natural disaster).
What do I mean by the last sentence?
Upon calculating the number of Empire State Buildings that could be filled to be 190 buildings, one can try to visualize the following: Imagine spreading the volume of 190 Buildings stacked together over an area of 253 square miles. The volume would obviously shrink as the area increases to eventually cover 12 inches.
After spreading the volume contained in the Empire State Buildings out to an area of 253 square miles, the picture would look like the following taken from "Twitter" shown below:
In the picture above, the cars are being carried down the street by the rainfall which resulted in extreme flooding. Regardless of the analysis that we try to perform here on this site, any loss of life is incomprehensible as well. Natural disasters cause a person to take a step back and appreciate what life we have. I hope that you do the same too as watching this one unfold on social media.
Conclusion...
Any loss of life due to natural disasters is a terrible thing to have to consider. The amount of rainfall that fell over the weekend on Elliot City and broader -- Howard County inflicted great damage. The analyses here showed the volume to be around 190 Empire State Buildings worth of water. Yes, that is correct. The amount of rainfall could fill 190 buildings -- Wow.
For a homework assignment, figure out the amount of Mercedes Benz Superdome (pictured below) that could be filled with the equivalent volume of water.
Before you carry out the calculation, take a guess whether the amount of Superdomes would be greater or lesser than the amount of Empire State Buildings. Provide your answer in the comments sections below. Until next time, have a great day!
All of us view the world from a different perspective. Literally, each of us look at the world from a different set of eyeballs -- which by definition means -- we see a different picture. Further, each of us view the world through our respective interests, occupation, life experiences. Why do I mention this obvious observation?
Recently, I was in Nebraska on vacation or to visit family more specifically -- which was much different than California. The inevitable discussion emerged between my brother-in-law, his boss (a cattle rancher) and myself centered around the drought in California. Any time that people from other states in the U.S. (either visiting or welcoming a visitor - me) find out that I am originally from California, a discussion emerges surrounding the drought crisis in California. Often times, I learn a new fact or piece of information that I previously did not know. In this instance, I learned that a farmer's dimensional analysis of a water crisis is projected in terms of cattle (not surprisingly). Below are the details of this wonderful and informative interaction.
Cattle Consume Water?
Of course cattle drink water! That did not surprise me in the least. What did surprise me was the discussion surrounding the drought in California. Over lunch (as mentioned above) a discussion emerged that had do to with the continuous drought conditions in California. My brother-in-law's boss was grilling me about California.
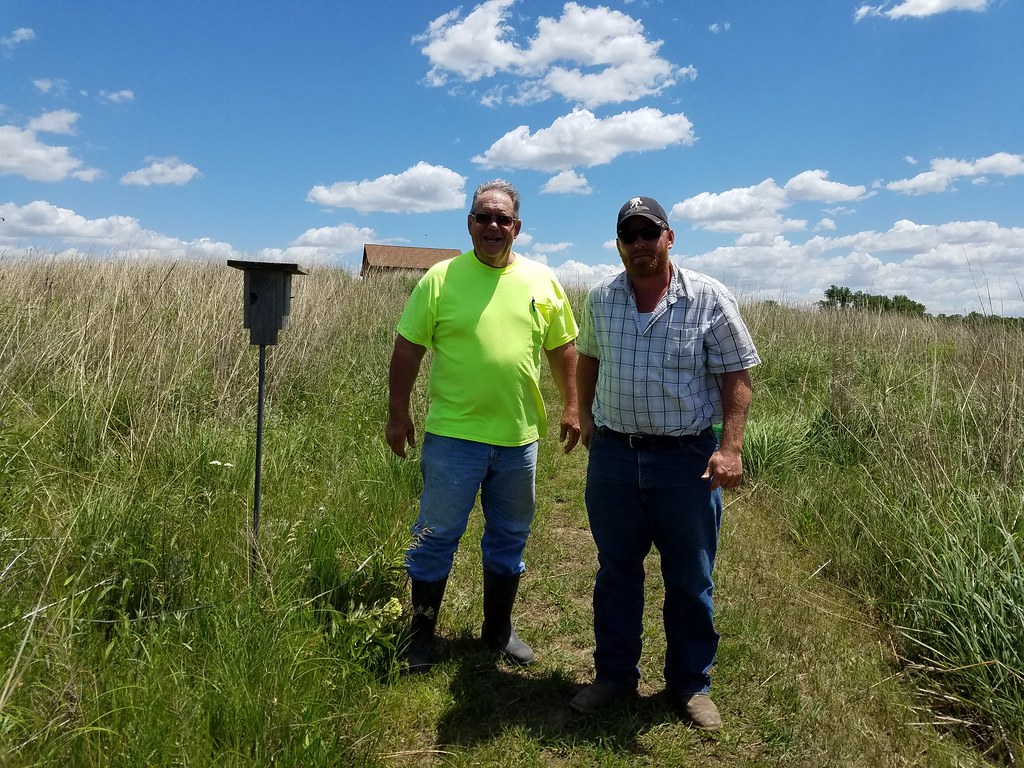
Not surprising since I stuck out in the restaurant like a "sore-thumb". Why you might ask? Here is a picture of my brother-in-law and his boss below:
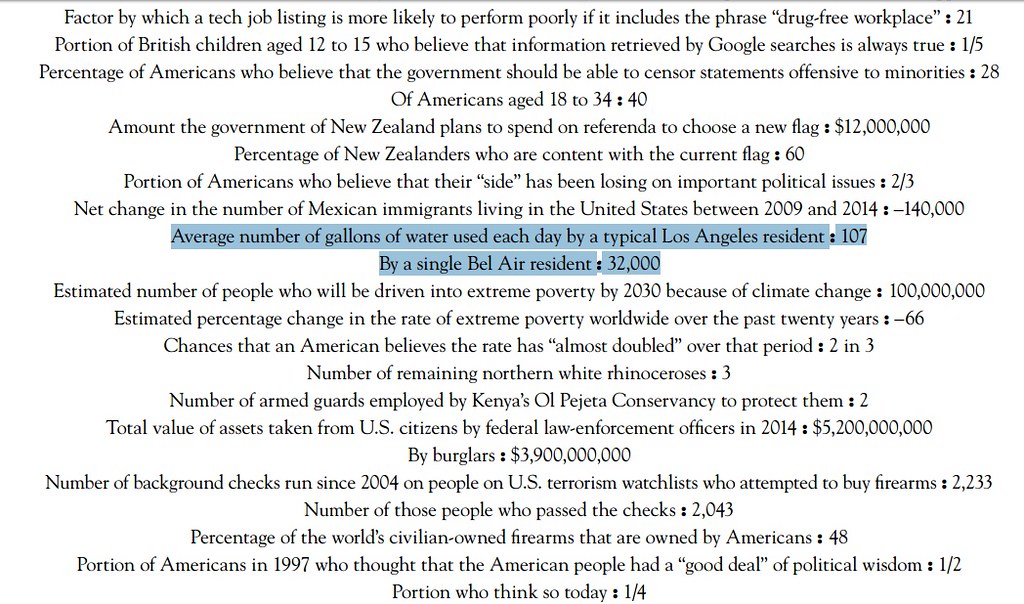
As we were discussing the drought in California, I decided to throw out on the table one of my newly discovered statistics about water usage in California. Which of the many do I speak of? I decided to discuss the difference in water consumption in water use -- which I wrote a blog post about a few months back. Here is the main statistic that blew my mind from Harper's shown below:
Over lunch I went ahead and gave a quick statement to invoke a response of surprise between the two residents of Los Angeles. I stated the the typical LA resident uses 107 gallons of water per day. He was not surprised at the amount. Next, I stated that the average 'Bel Air' resident uses 32,000 gallons of water per day. WOW.
What was his response?
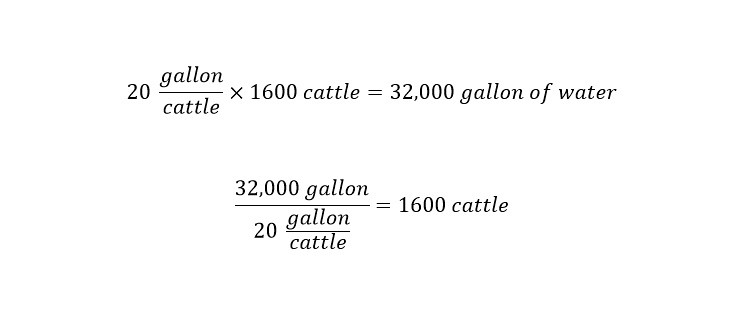
He rapidly returned with the statement: "On a hot day, one of my cows will drink max 20 gallons of water. I guess that equals 1600 cattle then now doesn't it."
I had to stop and run the math in my head for a moment. I was amazed at his perspective. In retrospect, as a cattle rancher, this makes perfect sense. He is concerned from the standpoint of how much water is required to keep his cattle optimized. I will show the calculation below:
There are two avenues by which to verify the cattle rancher (Scott's) quick calculation. First, take both of his numbers and multiply them together. Second, divide the total number of gallons by the number of gallons per cattle to get the total number of cattle. Either way, the calculations are straightforward. You might find yourself asking the following question:
So what? Big deal -- Everyone knows that Bel Air residents are outrageous water consumers?
True. From that conversation, I took home a few pieces of information -- which I will share:
1) Each of us look at life from a different perspective. 2) Each of us have our own reference point. 3) Each of us are unique. 4) Each Bel Air reside consumes as much water as 1600 cows on a daily basis!!!!
Conclusion ...
Look, I have wrote blog posts in the past about the outrageous use of water consumers here in California. Also, I have wrote about the amount of rain in a few inches of rain fall. I have to admit that this is the first time that I have used cows as a tool for dimensional analysis. The results are staggering.
In closing, each of us have a different perspective on how to view life. Further, for a farmer in Nebraska, the mention of water usage causes him to 'default' to his cows -- which makes perfect sense. Think about the number of cattle that could be drinking next time you turn on the faucet. How many cows are you starving? Until next time, have a great day!
No dam should ever contain as much water which would put an entire city in danger of being under 65 feet of water. Unfortunately, this is the case for a city named Mosul in present day Iraq. Based on history of dams busting (one of which I wrote regarding the mining spill in Brazil), having any body of water with such a huge amount of 'potential energy' above habitats is very dangerous. I decided to verify a statistic in the blog below regarding the dam in Mosul. Let me explain.
How Large Is The Mosul Dam?
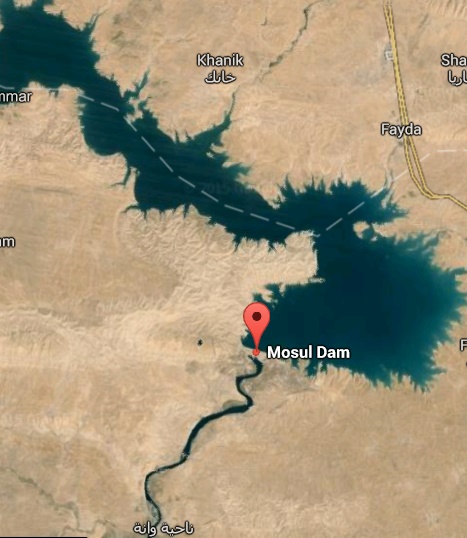
Below is a picture taken from a satellite of the Mosul dam along with the surrounding water that is contained within the reservoir.
Source: GoogleMaps
The Mosul dam is located in northern Iraq as shown on the map taken from the 'Wikipedia' page about the Mosul dam below:
According to the 'Wikipedia' page for the city of Mosul, the Tigris River is adjacent to the city (on the west bank). The population of Mosul is approximately 2.5 million people. The city is the second largest in Iraq and considered to be one of the largest northern commercial cities. Over the course of history, problems have been emerging with the wall of the Mosul dam as highlighted in the excerpt below:
The earthen embankment dam is located on top of gypsum, a soft mineral which dissolves in contact with water. Continuous maintenance is required to plug, or "grout", new leaks with a liquefied slurry of cement and other additives.[8] More than 50,000 tonnes (49,000 long tons; 55,000 short tons) of material have been injected into the dam since leaks began forming shortly after the reservoir was filled in 1986, and 24 machines currently continuously pump grout into the dam base. A September 2006 report by the United States Army Corps of Engineers noted, "In terms of internal erosion potential of the foundation, Mosul Dam is the most dangerous dam in the world." The report further outlined a worst-case scenario, in which a sudden collapse of the dam would flood Mosul under 65 feet (20 m) of water and Baghdad, a city of 7 million, to 15 feet (4.6 m), with an estimated death toll of 500,000.[9]
In an article written in 2014 on the website 'The Guardian' titled "Water Supply Key To Outcome Of Conflicts In Iraq and Syria, Experts Warn" the importance of having control over the Mosul dam cannot be overstated. If an extremist group such as ISIS were to take control over the Mosul dam, that would be strategic in controlling resources:
“It is already being used as an instrument of war by all sides. One could claim that controlling water resources in Iraq is even more important than controlling the oil refineries, especially in summer. Control of the water supply is fundamentally important. Cut it off and you create great sanitation and health crises,” he said
Isis now controls the Samarra barrage west of Baghdad on the River Tigris and areas around the giant Mosul Dam, higher up on the same river. Because much of Kurdistan depends on the dam, it is strongly defended by Kurdish peshmerga forces and is unlikely to fall without a fierce fight, says Machowski.
A 'bust' or 'break' in the dam wall would be catastrophic. The Iraqi people have been working against such a happening. Although, now, according to news sources, the situation is becoming worse. Furthermore, the threat to the city of Mosul and the surrounding area (Iraqi citizens who live outside of Mosul) who depend on the water for various purposes, should be concerned.
How much water is in the Mosul Dam?
In the excerpt taken from the 'Wikipedia' page for the Mosul dam, the estimates of a break would be a huge disaster. Nearly 500,000 people would be dead. The city of Mosul is estimated to be under 65 feet of water. Another article that was recently sent to me from the website 'Lab Equipment' confirmed the same statistic (65 feet under water) from the 2006 study. Reading this statistic, one cannot help but wonder the following question:
How much water does the Mosul dam hold?
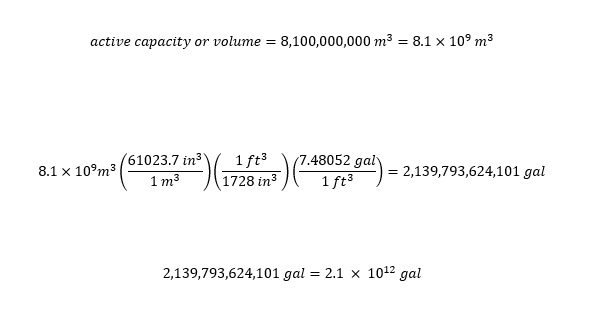
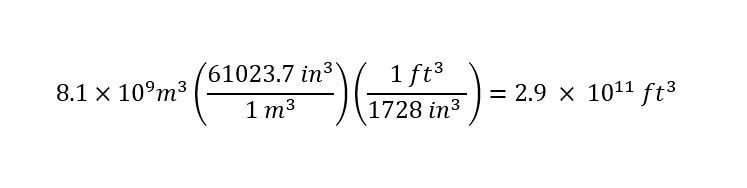
According to 'Wikipedia' the answer is around 11,100,000,000 cubic meters -- when full. WOW. That is a large amount of water. Do you believe me (the reader -- you)? How about if the number is converted to be expressed in gallons? Lets find out through dimensional analysis. First, we should adjust that value to be more representative of the actual 'active capacity.' According the the 'Wikipedia page' for the Mosul dam above, the 'active capacity' for the dam is closer to 8,100,000,000 cubic meters -- even though the 'total capacity is 11,100,000,000 cubic meters. Below I show the conversion from units expressed in cubic meters to units expressed in gallons:
Wow! Can you imagine taking part of the job of building the dam? Must have been quite an amazing job to be part of. That amount of water is enormous. Of course, entertaining large numbers on this blog post is getting to somewhat 'routine' -- which is good. Think of the volume of water in the Brazil mining spill. The amount of water stored in the Mosul dam is 132 times the amount stored in the mine dam in Brazil. Wow! Now that we have the enormous amount of water stored in the reservoir for water and/or utility generation purposes, the next question can be asked which is the subject of the blog post:
If the Mosul dam were to break, would the amount of water stored be enough to cover the city of Mosul in 65 feet of water?
In order to answer the question, the following values need to be calculated: 1) Area (length multiplied by width) of Mosul and 2) the volume of such a rectangular box that contains the amount of water in question. I was amazed when I first heard the statistic for the following reason. The reason is simply that between the city of Mosul and the dam -- their is a distance of 35 miles.
Depending on the geography and topology, the water might go different directs rather than just accumulate downstream in the city of Mosul. Therefore, the missing (among others) piece of information in the above article describing the break and the fallout calculated by the U.S. Army Core of Engineers must include the topology of the area. The water must accumulate in the city (downstream) of Mosul in the event of a break.
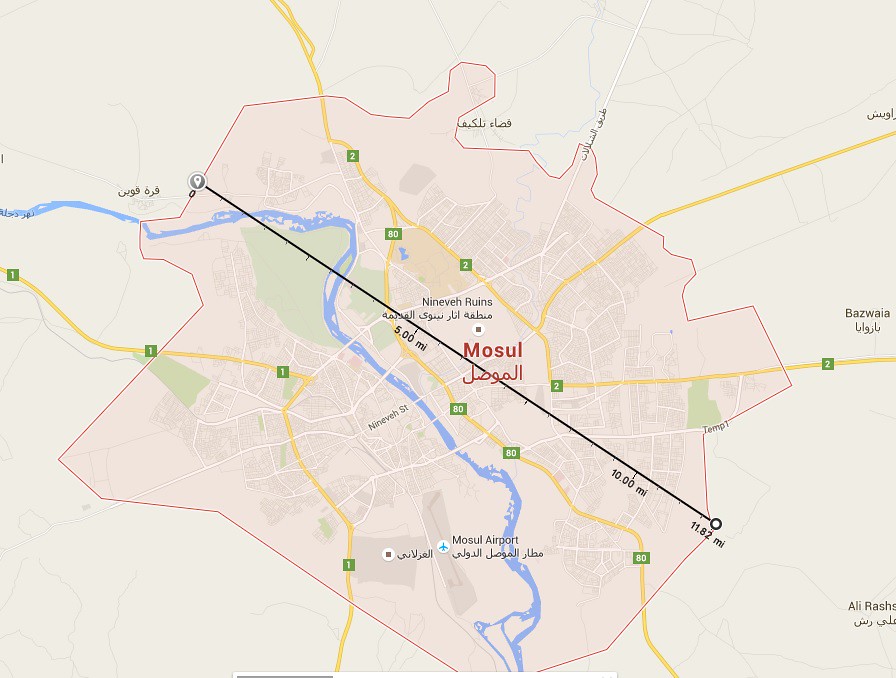
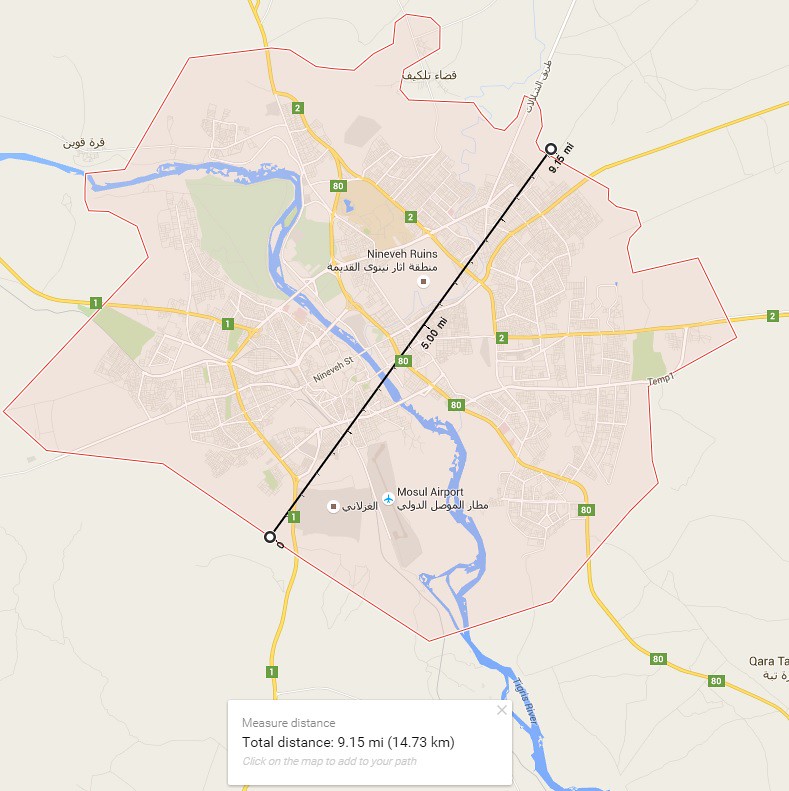
With these two 'pieces' of information unknown, we can still proceed with the calculation in question by a couple of approximations. First, the geography needs to be assessed to gather the area of the city of Mosul. According to GoogleMaps, the city of Mosul is shown below:
As you can see, I took the liberty to overlay a marker through the length of the city of Mosul -- which turns out to be 11.82 miles in magnitude. The shaded area of the city can be ROUGHLY approximated to be a rectangle. That is, in order to calculate an area of rectangle, the length and width must be known. The width is shown in another picture of the city of Mosul below by GoogleMaps:
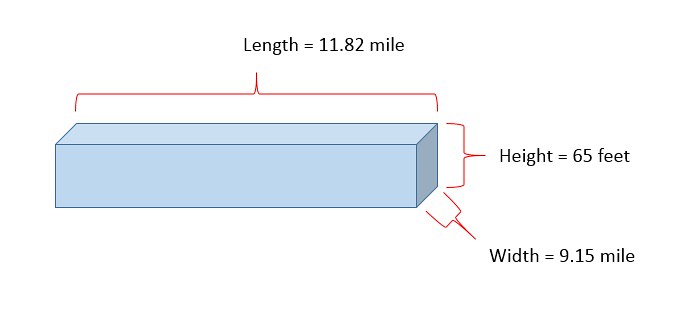
The width of the city of Mosul (according to my picture above) is 9.15 miles. With these two values in hand, there is only one value needed to figure out the volume of a rectangular box -- the height. From the article above, the height is the amount of water that the city of Mosul is proposed to be under (speculation) in the event of a dam break. That height is equal to 65 feet. The volume can be viewed below:
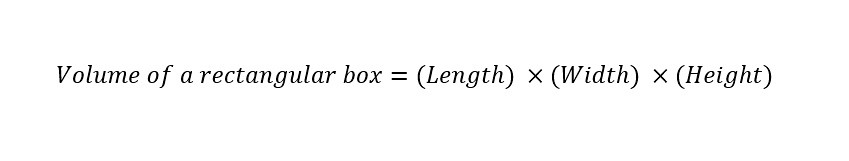
The rectangular coordinates given above match those from the GoogleMaps above for the city of Mosul. To determine the volume of a rectangular box, the equation for the volume is needed -- which is shown below:
In order to determine the volume, we just need to 'plug and chug'. 'Plug and chug' is a phrase used to execute the calculation by plugging in the values and being persistent (chugging) to determine the solution to the problem. In the current example, the equation is quite simple. Although, when you keep pursuing science -- sometimes the equations can get very complex. Further, sometimes so complex that a computer is needed to arrive at a solution.
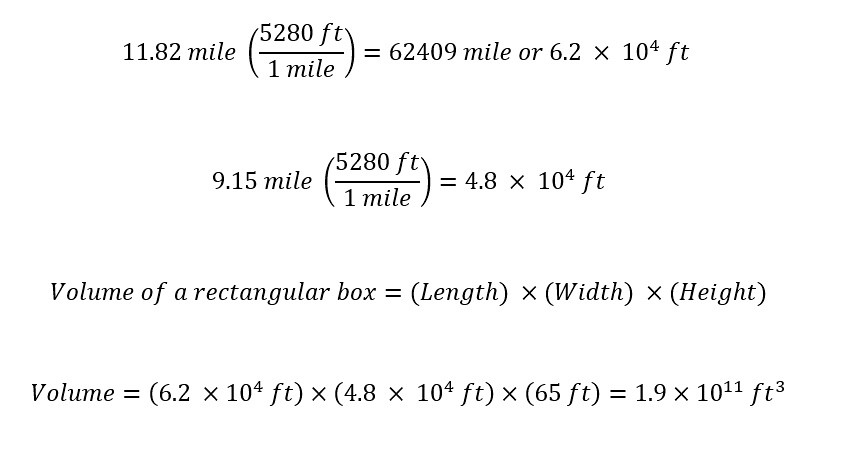
Lets finish determining the volume with the values above:
With the volume of the city of Mosul determined, we can determine if the volume of water contained in the Mosul dam is enough to fill the solution (volume of city of Mosul). First, we need to convert the volume of water in the Mosul dam to a value expressed in units of 'cubic feet'. The calculation is shown below:
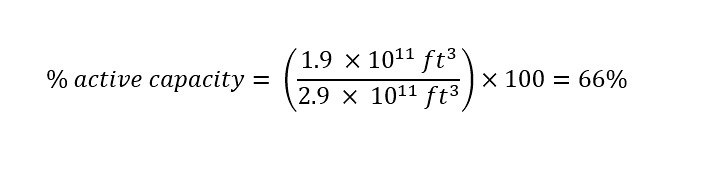
We can directly compare the two volumes now as shown below:
The volume of water required to fill the city of Mosul to a depth of 65 feet is only 66% of the total 'active capacity' (active volume) held in the Mosul dam. Wow! That is mind blowing. Each of the potential parameters (sewage, water, power, etc.) cited above in the 'Guardian' make sense. Especially, after performing the above calculations which cast the reported statistics into perspective. The Mosul dam is an important player in the current conflict in Iraq. The stakes are high and the fall out is extremely huge.
Conclusion
The real destruction comes as a result of the years without proper water, sewage, and the ability to desalinate the water from the Tigris River. Further, the destruction of the infrastructure as has been shown in Brazil where a massive amount of water rushes through a city or town and literally wipes out all of the infrastructure. The ability to rebuild would be diminished without proper resources, some of which are derived from the utility of having running or access to water resources.
That being said, the amount of destruction has been estimated and agreed upon by the United States of America and Iraq. Next needed is the ability to produce a solution that is viable and worth pursuing that is quick and sustainable -- two words which generally do not belong in the same sentence (quick, sustainable).
With all of the discussion surround the rain here in California and the drought, I would hope that a plan emerges in Iraq that is sustainable and attainable. Because, once the dam breaks, the water will flood Mosul and run off into the Persian Gulf. Which at that point, the water is no longer of use to the communities -- upstream or upriver from the ocean. The amount of resources needed to bring the water back into the city to rebuild would be insurmountable. The city might just languish -- pure speculation there (which equates to no value).
The amount of water involved in the discussion above is similar to other statistics seen on this blog post over the last couple of months. Lets make a change and make use of the water with the intention of writing a future post (in the form of a success of use) story with regard to its use. Until then, have a great day!
Over the course of the week here in Southern California (USA), we have been inundated with rain fall -- which the weather service attributes to a large 'oscillation' of temperature in the ocean called "El Nino." Regardless of the name of the storm, the water is much needed according to various news and State regulation agencies with all of the talk (over the last year) about 'droughts' and 'water shortages.' What struck me about all of the reporting was that I have had a new found appreciation for numbers (in inches) reported of rain fall over a given geographic region. To understand my new appreciation, I will have to go into a brief (could be a little long) back story which occurred over Christmas vacation. Of course, the results of this tangent are very relevant and might shed light on all of the reported volumes of water reported in the news regardless of the season -- drought or heavy rain fall.
Volume Of Rain Flowing Down The LA River
I start with the question: How much rain is flowing down the LA river? The reason why I chose this question in particular was due to a couple of recent news items sent to me electronically by friends. First, a friend posted a video on Facebook shown below:
Below the video in the notes the following message appeared regarding the video:
Is the California drought a scam?
"An inch of rainfall in L.A. generates 3.8 billion gallons of runoff, so you're talking about more than 12 billion gallons of water that could be captured, but that flows within hours down our concrete streets and into the ocean. There’s enough rainwater to be harvested to produce 30-50% of the entire city’s water needs."
"About half of the rainfall flowing down the Los Angeles River in a typical storm is lost to the ocean, according to the Water Augmentation Study from the Council for Watershed Health, a L.A.-based environmental organization. Most of the rainwater that bounces off roofs, parking lots, streets and sidewalks ends up in storm channels that flush rainwater into the ocean. That amounts to 10 billion gallons from an average rainstorm, enough to fill 120 Rose Bowls, said Alix Hobbs, president of Heal The Bay."
I have to admit, the video is not exactly the same video that I saw on Facebook. Still, the video appears to be very similar and to drive home the point of water just flowing out to sea. The posts on Facebook are labeled with concerns about 'wasted water.' Of course, the problem here is that the water is dirty and would need to be treated downstream and purified to be of any use to residents. With the exception of watering crops possibly (maybe).
The point is: the video above shows a massive amount of water due to just a couple of inches of rain fall. A statistic of 10 billion gallons is reported by the author above. Is this really correct? Can that much rain be falling from the sky and equate to a couple of inches of rain?
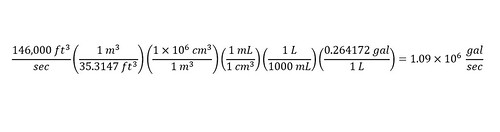
The river at its peak can move 146,000 cubic feet of water every second. At its normal rate, the Colorado River, sculptor of the Grand Canyon, doesn't do a quarter of that.
In the future, I will understand why reporters love to cite volumes in 'cubic feet.' For now, we just need to understand how many gallons/second is that equivalent to? The first calculation that I will perform (or show) will be the conversion of the 'flow rate' of 'cubic feet/second' to 'gallons/second.' I can think more clearly using units of 'gallons' rather than cubic feet. Below is the conversion:
Next, I asked myself, how long at the flow rate would the river have to flow in order to equal 10 billion gallons. Here is the calculation below:
Just over 2.5 hours -- Wow!!! That fits nicely with the values reported in the video notes. Meaning, that if water is flowing down the LA River, accumulating 10 billion gallons is not inconceivable. Not in the least. Of course, the flow rate used for the calculations is based on the 'maximum' speed recorded of the LA River in history. Regardless, the important message is that given enough time, a large amount of water flows down the river -- which would call into question the need to scare the public about droughts in California. I realize that the water is not usable directly from the river.
You might be wondering why I am thinking about the subject. I mean, aside from the recent storms that have hit Southern California over the past week and a half along with the blaring news bites about 'El Nino'. Part of the answer lies in the fact that I had large amounts of water on my mind when writing the earlier post regarding the flood in Brazil as a result of a damaged dam due to mine waste water. The other part is due to news which I received over the winter break visiting family.
How Many Gallons Of Water Equals 2 inches Of Rain?
Over winter break, we got together with family. Getting together means talking about current events. One current event was the rainfall that was hitting the Lake Tahoe region. The reason being is that my brother-in-law's family lives up near the lake. Each year, my sister and her family go and tear up the ski slopes for a few days. Therefore, their interested in storm reporting in the region.
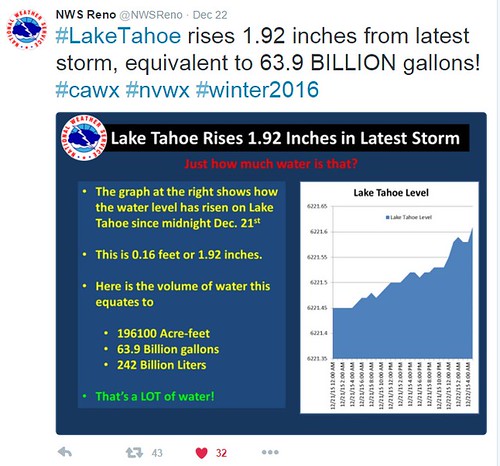
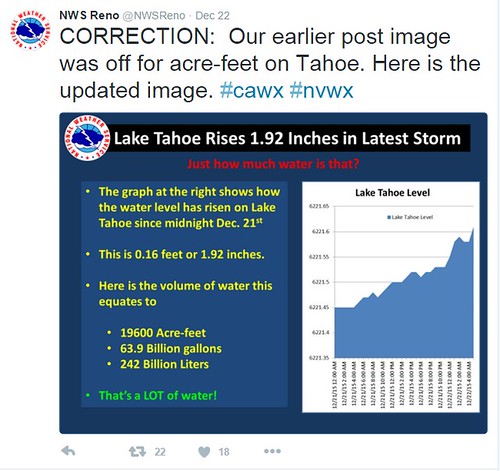
Anyways, during a conversation regarding the weather up in the region (Lake Tahoe), I heard a number which blew my mind. I almost thought that I had a hearing issue. I asked for clarification and sure enough, I had heard correctly. The number in question was the amount (volume) of water that filled up 1.92 inches in Lake Tahoe was equivalent to 63 billion gallons.
At first, I did not believe this number to be correct. In fact, had I not previously been entertaining the number (15.9 billion gallons) which was equivalent to the mining spill in Brazil, I really would have thought my family to be insane.
After finding the tweet shown above, I just still could not wrap my head around the gigantic volume of 60 billion gallons correlating to just 1.92 inches of rain. I would believe more height to be associated with that volume. Why did the volume bother me terribly? I guess because I had not yet checked the number with a calculation of my own.
First, I think a little perspective might be needed at the moment to visualize this massive amount of water. If you have never visited Lake Tahoe, then the volume of water contained in the lake is truly unimaginable. The shoreline perimeter is 72 miles around the entire lake. One can even see the lake from space.
With the information about the LA River along with the image above, the volume reported does not seem outlandish. Although, at the time that the number of 60 billion gallons was reported to me, all of the above information had not been known to me. I had to do a small amount of research -- which is part of this post.
In fact, when we (you and I) hear or see statistics, we should not just take them at face value and believe them. A small amount of research can go a long way -- as you will see shortly. Without knowing much, how could a person check to see if the number was correct?
How can the volume be determined knowing the value of both perimeter and height?
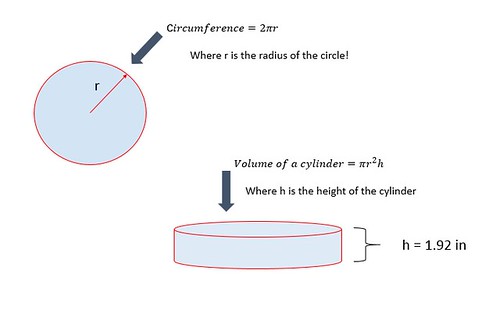
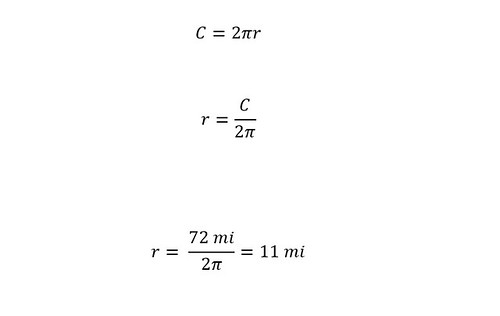
Well, knowing the value of the perimeter in miles allows us to carry out an approximation to determine the volume. We could approximate the lake to be a circle and then figure out the volume based on an equation for a cylinder. Below, I show the approximation I made initially to do a 'rough check' of the reported number.
In the picture above, a circle is shown with a 'circumference' (as "C" equal to 72 miles -- perimeter of Lake Taho) which is equal to a factor of 2pi multiplied by a 'radius'. Since the 'circumference' is known, the 'radius' can be determined through rearranging the equation -- as shown below.
The calculated radius is expressed in units of 'miles'. In order to calculate a volume of a cylinder with height expressed in units of 'inches' then the radius must be converted from 'miles' to 'inches' as shown below:
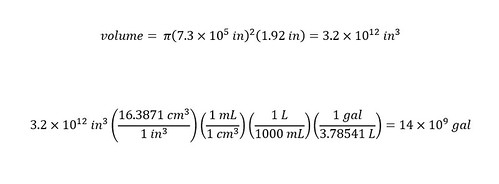
With the radius known, the next step toward figuring out the volume of rain that correlates to the 1.92 inches of rain that was deposited into Lake Tahoe is to use the equation for the volume of a cylinder. In the same picture with the circle, there is an equation for the volume of a cylinder. A factor of pi squared multiplied by the radius and height gives the total volume of a cylinder as shown below:
The volume is expressed in 'units' of cubic inches -- which might not be useful for most people. Unless, of course, you think in terms of cubic inches or cubic feet, etc. To each his own! I am more comfortable with gallons and since the article cites water volumes in gallons -- we will stick with that unit. Therefore, below the equation for the volume, I converted the volume expressed in units of cubic inches to units of gallons using dimensional analysis.
According to my approximation using a circle, the answer (for volume) is short compared to the value reported by the news (KRON) of 63 billion gallons. Why? Ask the following questions:
1) Is the 'run-off' water from surrounding region (the mountains) the difference in volume?
2) Is the approximation of a circle that far off?
3) Is there a more accurate way to calculate the volume?
I had these questions after calculating the differences in volume. One of the most powerful advantages of having access to 'social media' is the ability to ask questions. I decided to inquire into the difference between the number I calculated and the reported number. In order to inquire into the difference, I had to find out where the number (reported number) originated.
-Transparency in reported numbers is needed
I started looking into the origination of the reported number of 63 billion gallons of water that was supposedly dumped into Lake Tahoe. What I found was very interesting. You might find the answer to be drawn out, but that is how research is done on a everyday basis. Why should investigating the source of a 'reported value' be any different? The methodology is the same as shown below.
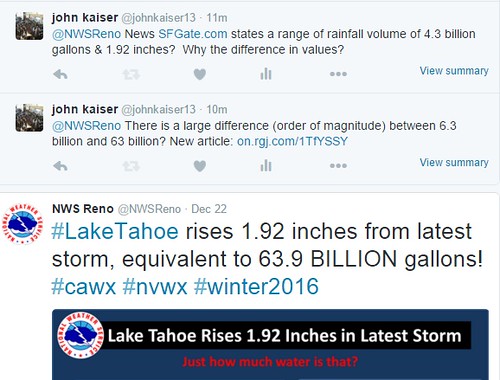
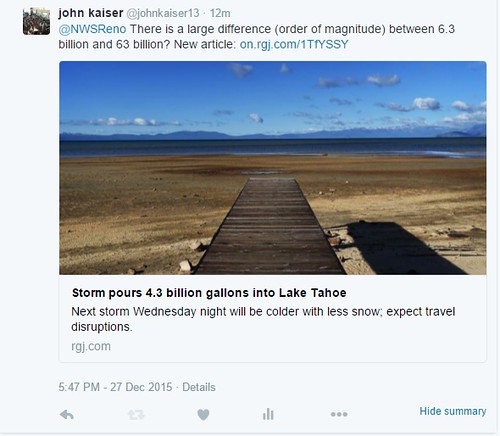
First, I found an interesting article upon investigating further the source of the volume of 63 billion gallons of water which differed from the original value. The 'SF Gate' reported a number far less than either the original value (63 billion gallons) or our calculated value (14 billion gallons). Their value was based on a 'correction' of 6.3 billion gallons. Wow! The difference being nearly 57 billion gallons from the original value and half of our calculated value (14 billion). What is going on here?
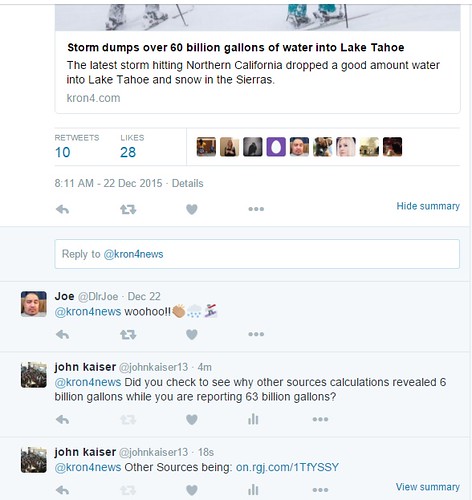
I decided to turn to social media (Twitter) and ask KRON about the difference in values as shown below:
Shown above is the inquiry to which I have yet to receive an answer from KRON for. I decided to find out where the news organizations got the source from. After searching into the twitter accounts of both KRON and SFGate, I found that the source originated from the National Weather Service -- Reno office. Finally, I found the source on their Twitter feed shown below:
Above the tweet is another correction to the original reported value shown below:
The correction was to the value reported in "Acre-feet". I wondered if another correction would be issued for the value reported in 'gallons.' I decided to ask the NWS Reno by tweeting to them as shown below:
I included the article reporting the difference in volume -- which was significant -- below:
I waited for an answer and expected one. Not really. Although, a few news agencies are good at getting back to an inquirer quite quickly. Therefore, if you have a question, go ahead an ask someone via 'social media'. You might be surprised at the ability to get a question answered. Since the question above was to a government agency, my expectation was low.
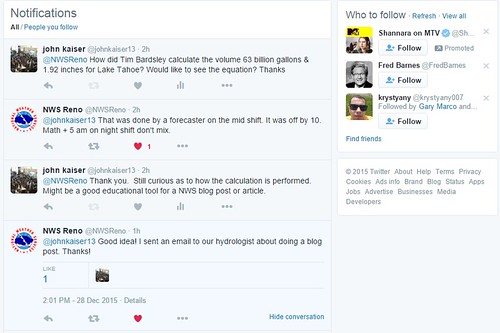
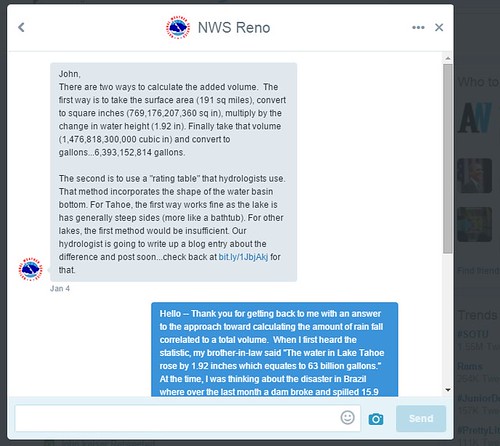
A few days later, I was pleasantly surprised when an employee from the National Weather Service at Reno responded to my question on Twitter. Shown below is the response:
The forecaster that performed the calculation was Tim Beardsley from the NWS Reno. As indicated above, the initial value that was calculated was off by a factor of 10. Meaning, that the true number was 6.3 billion gallons of water NOT 63 billion gallons of water. Additionally, you can see that I still asked to see the equation or method that Tim used to calculate the value. I was left still unsatisfied.
Surely, I should be able to calculate the value to within the same 'order of magnitude'. At this point in time, I had to wait for another response. Keep in mind, this correspondence was occurring over the holidays. I was surprised that any responses were given. The first week in January, Tim Beardsley responded with the method that he used to calculate the volume of water into Lake Tahoe corresponding to 1.92 inches of rain fall. Shown below is his response on twitter:
After reading his response, I could see that his method was simpler. I did not realize that a value for the surface of Lake Tahoe was known. I felt rather stupid -- brain fart. Of course, use the area of the lake and then multiply that value by the height -- as shown above in the equation for the volume of a cylinder.
To verify his calculation, I repeated exactly what was reported above in the tween response. I show the results below:
As you can see, the calculation is easier than our approach. The calculation is simplified by having the 'area' -- which is equal to (pi multiplied by the radius squared).
Still, the question remains where the difference of almost double the volume comes in. I imagine that the difference is due to the calculation of the perimeter distance. Or that Lake Tahoe is not a perfect circle.
Conclusion
Regardless of the true value reported here by the news organizations, a few observations can be made in conclusion:
1) Do not take a value reported by the news as to be 'absolute truth'.
2) Different methodologies of calculating volume can give VERY different answers.
3) Different answers have VERY different meanings.
Again, no one is perfect as shown above. There were two considerations that were not discussed in the blog post among others (I am always open to suggestions). The first was that in the corrected twitter post by the NWS Reno, the value of 'acre-feet' was off by an order of magnitude. A large difference exists between 196,100 acre-feet and 19,600 acre-feet. How large? Exactly 176,500 acre-feet. How did that difference arise during the calculation?
The second consideration was that there exist a second method by which to calculate the total volume of rain fall by hydrologists. According to the explanation above from the NWS Reno, a 'Rating Table' is used by hydrologists (click here). Regardless, a greater degree should be a goal of the National Weather Service in Reno regarding the method of calculating weather conditions.
A few readers might not agree with the last statement regarding organizations being more transparent with their methodologies. Ask yourself the following question:
How many times have you looked out the window after looking at the weather forecast and said "Wow, the weather channel really got that wrong?" "I wonder how the weather channel came to this conclusion?" This should warrant a greater degree of transparency -- for those interested in understanding the methodologies used.
As I have shown above, the amount of rainfall that drops on Southern California is quite large. Not just quite large, but HUGE. Scientists and engineers should be trying to come up with methods to capture this water for alternative methods. Or at least building 'floatable turbines' or another method to turn the mechanical energy (the energy of flow of water) into electrical energy. What do you think? How would you harness that power? Until next time, enjoy pondering the numbers reported in the post. Have a great evening.