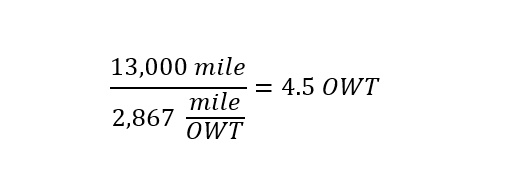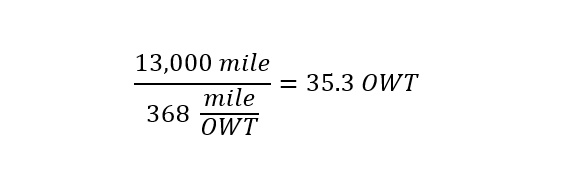
Source: C&E News
Tracking bees can be a complicated job. Especially, when from the macroscopic level (human eye), each bee appears to be the same in appearance. Which causes a person (at least me), how would a scientist studying bees track individual bees within a bee colony (or beehive)? Further, why would a scientist want to keep track of individual bees within a beehive? Well, in short, your answers are below.
How Do Insecticides Affect Bees?
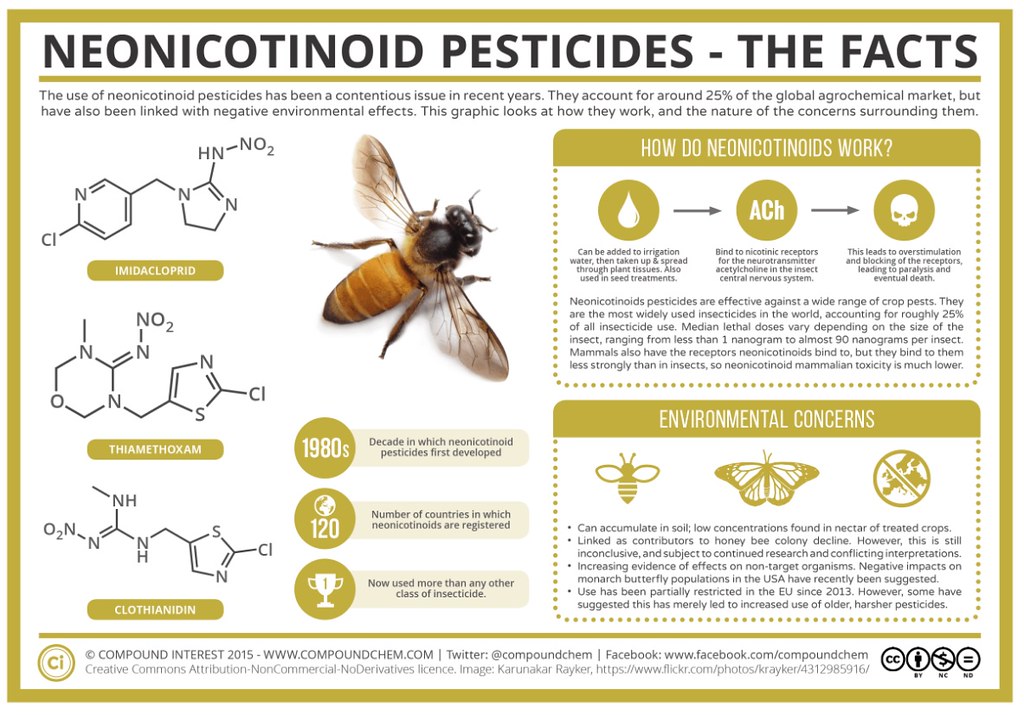
Over the last couple of decades, there has been controversy surrounding the use of insecticides (certain classes of insecticides). An insecticide is a substance (chemical or compound) which is used to kill an insect. The difficult question is whether certain insecticides which are aimed to kill specific insects also have adverse (negative) impacts on unintended target insects (such as bees). The specific class of chemicals in question are the 'neonicotinoids' which are shown below on this graphic:
Source: Compound Chemistry
The chemical structures of the neonicotinoid family of compounds shown on the left hand side of the infographic above are shown below in greater detail:
(1) Acetamiprid,

(2) Clothianidin,

(3) Imidacloprid,

(4) Nitenpyram,

(5) Nithiazine,

(6) Thiacloprid

(7) Thiamethoxam

The compounds above are classified as neonicotinoids due to their chemical similarity to the chemical structure of nicotine shown below:

As a chemist, I always tend to wonder what aspects of each molecule make that molecule great for binding to a given receptor. You may think that I am speaking gibberish at the moment, but let's take a brief exploration into the mechanism (mode of action) by which these chemicals operate in the insects body (to become toxic) provided by Compound Chemistry:
This leads us on to how neonicotinoids exert their effects on insects. They are effective against a wide range of different pests, and all act in a similar manner. Neonicotinoids are systemic insecticides – meaning they are water-soluble, and can be absorbed by plants and distributed through their tissues. When insects ingest them, they bind to and block nicotinic receptors for the neurotransmitter acetylcholine in the central nervous system of insects. Acetylcholine is a neurotransmitter in many organisms, including humans. The effect of blocking the receptors for this neurotransmitter is overstimulation, which leads to paralysis and eventual death for the insects.We also have nicotinic acetylcholine receptors, both in our central nervous system and the peripheral nervous system, so you might wonder why the neonicotinoids don’t pose just as big a danger to us. This is because, although both insects and us have the receptors, they are differently structured, and the upshot of this is that the neonicotinoids don’t bind to our receptors as strongly as they do to those of the insects. As such, they are much more toxic to insects than they are to us, or other mammals.An insect doesn’t need to ingest a great deal of a neonicotinoid pesticide for it to exert its deadly effect. The exact figure is, of course, variable, depending on the specific species of insect. Values for the median lethal dose (the dose that kills 50% of test subjects) range from 1 to 90 nanograms per insect. For comparison, the lethal dose figure for neonicotinoids is several orders of magnitude lower than for older insecticides such as the controversial DDT.
The current study (discussed briefly below) aims to check to see the lower limit of exposure to the toxic insecticides. At what concentration, does a change of behavior occur? How long does the exposure take to translate into adverse effects on beehive colonies.
What about the current scientific study of bees?
You may have thought that the content above is a 'divergence' from the study at hand. The title of the current study is Neonicotinoid exposure disrupts bumblebee nest behavior, social networks, and thermoregulation. The study which aimed to track the behavior of bees as a result of 'dosing' the bees with different concentrations of insecticides. Why is this important?
Because the insecticides which are commonly used on crops have been associated with adverse (negative impacts) phenomenon such as 'colony collapse disorder' -- which is when the majority of the 'worker bees' leave a beehive and the colony (or hive) will eventually perish. Why does this phenomenon occur?
One contribution (a part of the aim for the current study) is the exposure of the 'worker bees' to the insecticide (in this case imidacloprid) while carrying out their duty as 'pollinators'. Pollination is the process of fertilizing the flower to produce seeds (offspring) -- i.e. the next generation. The importance of pollination to the agriculture industry cannot be overstated.
For the study published, the insecticide of choice was imidacloprid. The range of concentrations varied between 0.1 nanograms and 9 nanograms. What? Yes, the lowest concentration which served as the control group was between 0.0000000001-0.000000001 grams. Whereas for the group being dosed with a toxic dose was around 9 times the top of the control group range = 9 nanograms or 0.000000009 grams. Or stated in terms of 'parts per billion' -- control group = 0.1-1 parts per billion...and the toxic dose was 9 ppb (parts per billion).
A recent write up of the study appeared in a trade journal -- Chemical & Engineering New. Here is the brief which appeared in a recent (late last year) issue of C&E News:

Source: C&E News
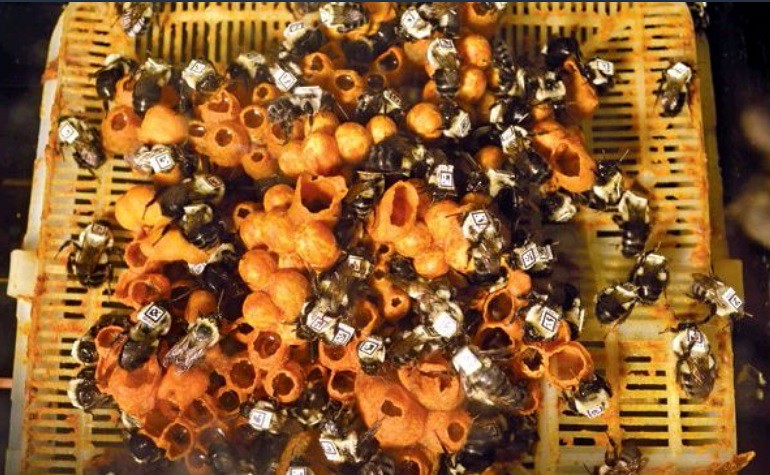
Wait...How did the scientists track the bees in the beehive? The scientists glued small QR codes onto the bees. Then the tracking was accomplished by using robotic platform with an imaging system known as BEEtag. An example is shown below (24 seconds in length):
What were the results of the study published?
The results of the study using the BEEtag imaging platform were straightforward. At the control concentration of 0.1 ppb of imidacloprid, no change in bee behavior was observed. Whereas at concentrations of 6-9 ppb showed noticeable change (adverse effect) in beehive behavior. The indication was that the bees exposed to toxic amounts of imidacloprid were observed to move eventually toward the outside of the beehive. Additionally, the workers were less active and became more sedentary.
Nonetheless, the imaging technology used above has opened the door to observing negative impacts of chemical exposure previously only speculated about. This is tremendously exciting to say the least. For further details of the study, click on the title of the study above. Next steps include to see if the other compounds (chemicals) in the neonicotinoid family of substances produce the same adverse effects at the equivalent doses. Stay tuned.
Related Blog Posts:
NIDA Director Nora Volkow: How Health Communicators and Journalists Can Help Replace Stigma with Science
What is the next big step in Mental Health Research?
Astrophysicist Neil deGrasse Tyson explains why 'Space Force' is nothing new...
Scientists should find similarities rather than focus on differences
Why Chemistry Matters from the mouths of Nobel Laureates!
President Trump finally fills the Office of Science and Technology Policy position - Yeah!